Microfluidic chain reaction of structurally programmed capillary flow events
Mohamed Yafia, Oriol Ymbern, Ayokunle O. Olanrewaju, Azim Parandakh, Ahmad Sohrabi Kashani, Johan Renault, Zijie Jin, Geunyong Kim, Andy Ng & David Juncker
Chain reactions, characterized by initiation, propagation and termination, are stochastic at microscopic scales and underlie vital chemical (for example, combustion engines), nuclear and biotechnological (for example, polymerase chain reaction) applications1,2,3,4,5. At macroscopic scales, chain reactions are deterministic and limited to applications for entertainment and art such as falling dominoes and Rube Goldberg machines. On the other hand, the microfluidic lab-on-a-chip (also called a micro-total analysis system)6,7 was visualized as an integrated chip, akin to microelectronic integrated circuits, yet in practice remains dependent on cumbersome peripherals, connections and a computer for automation8,9,10,11. Capillary microfluidics integrate energy supply and flow control onto a single chip by using capillary phenomena, but programmability remains rudimentary with at most a handful (eight) operations possible12,13,14,15,16,17,18,19. Here we introduce the microfluidic chain reaction (MCR) as the conditional, structurally programmed propagation of capillary flow events. Monolithic chips integrating a MCR are three-dimensionally printed, and powered by the free energy of a paper pump, autonomously execute liquid handling algorithms step-by-step. With MCR, we automated (1) the sequential release of 300 aliquots across chained, interconnected chips, (2) a protocol for severe acute respiratory syndrome-coronavirus-2 (SARS-CoV-2) antibodies detection in saliva and (3) a thrombin generation assay by continuous subsampling and analysis of coagulation-activated plasma with parallel operations including timers, iterative cycles of synchronous flow and stop-flow operations. MCRs are untethered from and unencumbered by peripherals, encode programs structurally in situ and can form a frugal, versatile, bona fide lab-on-a-chip with wide-ranging applications in liquid handling and point-of-care diagnostics.
We kindly thank the researchers at McGill University for this collaboration, and for sharing the results obtained with their system.

Main
The MCR encodes the deterministic release of reagents stored in a series of reservoirs, with the release of reservoir n being conditional on the emptying (draining) of the reagent in reservoir n − 1, and emptying reservoir n, in turn triggering the release of reservoir n + 1. Capillary domino valves (CDVs) encode this condition, and serially connect, that is, chain, the reservoirs, and thus control the propagation of the chain reaction (Fig. 1a). MCRs were implemented in three-dimensionally printed circuits made with a common stereolithography printer with feature size from 100 µm to 1.5 mm, hydrophilized using a plasma chamber (Extended Data Fig. 1 and 2), sealed with a plain cover and connected to a capillary pump made of paper (filter papers or absorbent pads). The paper was spontaneously wetted by aqueous solution drawn from the microfluidic circuit by releasing free energy stored in the paper surface, and this drove the chain reaction; expressed differently, the capillary pump generated a negative capillary pressure that was hydraulically transmitted back into the circuit through the main channel and serially drained side-reservoirs connected by a small conduit, called the functional connection (further described below). CDVs form air links between adjacent reservoirs, serially connecting them along a path parallel to the main channel, but interrupted by filled reservoirs that form liquid plugs between CDV air links. When the (first) reservoir connected to the air vent through a continuous air link is emptied, the plug is removed and the length of the air link propagates to the next filled reservoir in the MCR (Fig. 1a–d and Supplementary Video 1). This simple design structurally encodes the conditional propagation of capillary flow events and the step-by-step release of an arbitrary number N of reservoirs without peripheral connections or moving parts, and is further detailed in the Supplementary Information.
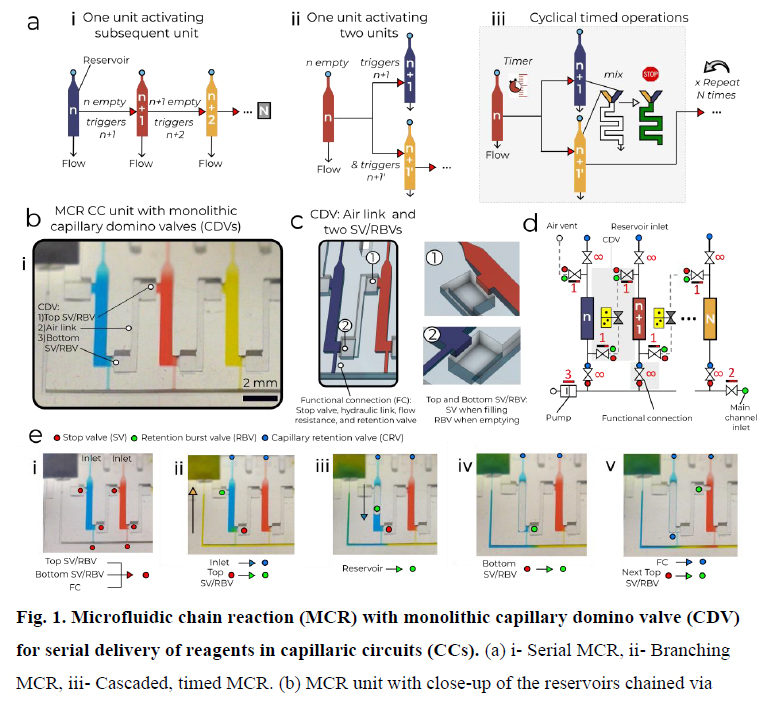
a, (i) Serial MCR, (ii) branching MCR, (iii) cascaded, timed MCR. b, MCR unit with three reservoirs chained through CDVs and close-up of dual function SV/RBVs that keep liquid out of the CDV air link (forming a pneumatic connection) and prevent premature drainage. c, Symbolic view of the MCR unit with capillary retention valves (infinity symbol), CDV (grey overlay) that includes an air link, two SV/RBVs and functional connection. d, Screen shots of Supplementary Video 1 showing MCR sequences in which most of the capillary elements have dual functions, one during reagent loading, one during MCR propagation. (i) A loaded chip with liquids confined to the reservoirs by physical and capillary valves. (ii) MCR is triggered (the inlet becomes a capillary retention valve and the top SV becomes a RBV). (iii) Emptying of the first reservoir on bursting of the top RBV. (iv) The bottom SV momentarily becomes an RBV that bursts immediately. (v) Air now occupies the emptied reservoir. The functional connection (FC) becomes a capillary retention valve preventing the air from penetrating into in the main channel. The air link connects the air to the RBV of the next reservoir, which bursts and triggers reservoir emptying. Scale bar, 2 mm.
MCRs require ancillary capillary microfluidic components that fulfil different functions depending on the intended operation (for example, loading, holding, mixing and draining liquids following the MCR progression) to form fully integrated and scalable capillaric circuits (CCs). CCs are designed on the basis of a library of building blocks including capillary pumps, flow resistances and many types of capillary valve (stop valves (SVs), trigger valves, retention valves, retention burst valves (RBVs))12,14, and thus are analogous to microelectronic integrated circuits, but lacking the scalability and functionality. In MCRs, samples are loaded by capillary flow through an inlet with a capillary retention valve and entirely fill the reservoirs lined with three SVs, including two with a dual RBV function connecting to the two lateral CDVs, and one at the intersection of the functional connection and the main channel (Fig. 1c). Although the functional connection is a deceptively simple straight channel, it fulfils six key functions. It is (1) the air vent during filling of the reservoir, and (2) a SV preventing the reagent from spilling into the main channel while it is empty. After filling of the main channel, it forms a (3) hydraulic link propagating the pressure from the main channel into the reservoir and (4) a barrier (and bottleneck) to the diffusion of reagents between the reservoir and the main channel. (5) It becomes the outlet and a flow resistance (discussed further below) during reservoir emptying, and (6) a capillary retention valve stopping air from invading the main conduit after the reservoir is emptied. As a result, many trade-offs guide its design.
We sought to understand the design window and failure modes of MCRs, notably under which conditions downstream of CDVs might trigger prematurely, using both theory and experiments. MCR-CCs incorporate numerous capillary SVs according to previously established design criteria13 and while considering three-dimensional (3D) printer performance including resolution, imprecision and printing errors. We then analysed the MCR based on an electrical circuit analogy (Extended Data Fig. 3) and derived a simplified circuit that neglects minor resistances (Fig. 2a)13. Successful and incremental propagation of the MCR is conditional on preventing the breach of the liquid in reservoir n into the CDV and air link connecting n + 1, which is equivalent to stating that all the liquid in reservoir n must flow exclusively through the functional connection n.
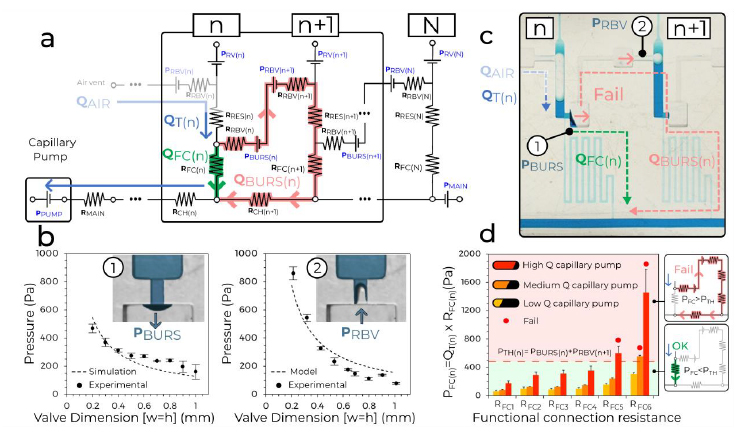
a, The simplified equivalent electrical circuit of the MCR units shown in Fig. 1. b, Experimental SV burst pressure (1) and RBV retention pressure (2) for valves with conduits with different, square cross-sections fitted with a numerical and an analytical model, respectively. c, Illustration of failure for a CDV with long serpentine FCs with very high resistance leading to liquid breach inside the air link, and premature draining of reservoir n + 1. d, Tests of six MCRs with increasing RFC and three different paper pumps to determine the effect of varying the flow rate (n = 3 for each paper pump and RFC). All data points are shown in b and d. Error bars are standard deviations from three experiments, the centre of each error bar is the mean value. As predicted, the CDVs fail when the pressure drop across the FC PFC(n) exceeds the CDV threshold pressure PBURS(n) + PRBV(n+1).
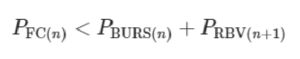
The flow path from reservoir n to n + 1 is interrupted by the CDV, which includes the capillary SV at one extremity and RBV at the other, with bursting thresholds of PBURS and PRBV, respectively. If either of these valves fails prematurely, then the propagation of the MCR is at risk of disruption. But because both valves are pneumatically connected by the air trapped within the air link, their pressures are additive and hence the threshold for failure of either is the sum of the two. The condition for success is QFAIL = 0, which during drainage of reservoir n is satisfied if the pressure drop on the functional connection (FC) PFC = QFC × RFC is (see also Supplementary Information for a detailed mathematical derivation):
We calculated PBURS (numerically)20 and PRBV (analytically, Supplementary Information) for conduits with a square cross-section (W = H) for the typical dimension in our 3D-printed CCs, and measured them experimentally for validation (Fig. 2b and Extended Data Fig. 4). Both PBURS and PRBV are inversely proportional to the smallest dimension of the rectangular conduit. We accounted for the hydrophobic ceiling formed by the sealing tape in both cases (Extended Data Fig. 2b), and which is a key feature to forming a functional SV20. Note that because of the comparatively low pressures and small volume of the air links, the compressibility of air is negligible here.
Next, several MCRs featuring functional connections with large and increasing RFC were tested with pumps with different capillary pressure and flow rates. The interplay between the resistance and the flow rate determines the operational window for the CDV while they are inversely proportional. We found excellent concordance between theory and experiments for the operation window of the MCR, and failure only occurred for the highest values of RFC (nos. 5 and 6), and for only the most powerful capillary pumps (Fig. 2c,d and Extended Data Fig. 5). The MCR designs used in the proof-of-concept applications, shown below, are well within the failure threshold, helping to ensure reliable propagation of the chain reaction.
We designed a chip-to-chip interface with a leakage-free connection for liquid (main channel) and air (connecting the CDVs), respectively, and connected four chips with 75 MCRs each (Fig. 3a and Supplementary Video 2). This result illustrates the reliability of the MCR and of CDVs, and demonstrates integrated, large-scale fluidic operations by ‘passive’ capillary microfluidics, beyond the capability of many ‘active’, computer programmable microfluidic systems.
Fig. 3: Large-scale MCR and COVID-19 serology assay in saliva.
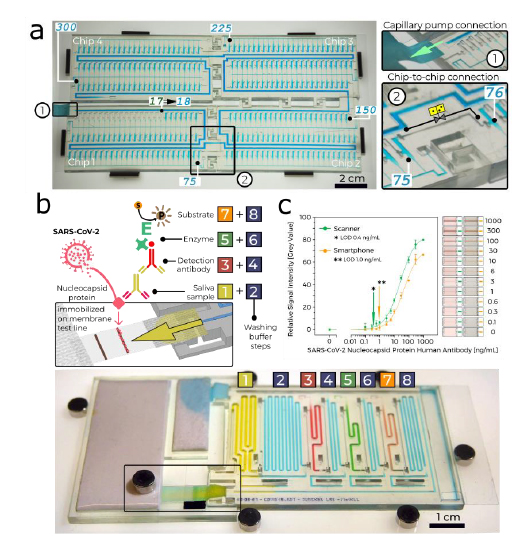
a, A MCR of 300 aliquots stored in 4.9 µl reservoirs across four chained and interconnected chips (Supplementary Video 2). b, SARS-CoV-2 antibody detection in saliva. Sequential, preprogrammed release of reagents by MCR is triggered by connecting the paper pump (Supplementary Video 3). The MCR supplies four reagents and four buffers in sequence. The functionality includes delivery and removal (by flushing) of solutions, metering (40–200 µl) by reservoir size, flow speed and time control by the flow resistance of the FC and the capillary pressure of the paper pump. The enzymatic amplification produces a brown precipitate line visible to the naked eye. c, Assay results and binding curve obtained by spiking antibody into saliva, and imaging by scanner and cell phone with representative images of the detection zone for each concentration, indicating the potential for quantitative point-of-care assays. d, An assembled chip filled with coloured solutions highlighting the channels for the different reagents and washing buffer.
Apparatus /
Materials

Automated SARS-CoV-2-specific saliva antibody detection assay
We measured antibodies against the nucleocapsid protein (N protein) of SARS-CoV-2 in saliva, with application potential for early infection detection21,22, initial patient assessment as prognosis indicator23 and for serosurveys to differentiate vaccinated and naturally infected individuals24. Conventional lateral flow assays with predried reagents are simple to operate, but typically do not include enzymatic amplification that underlies the laboratory enzyme-linked immunosorbent assay (ELISA), and have to be read out within a few minutes of completion. Here, we used MCR to automate a sequence of eight steps in common laboratory ELISA protocols (Fig. 3b and Supplementary Video 3). The chip is connected to a small paper pump to drain excess buffer, and a nitrocellulose strip for assay readout itself connected to a large-capacity paper pump that drives the MCR. Note that the MCR propagates in a direction opposite from the flow in the main channel, and reagents released sequentially from reservoirs all flow past previously emptied reservoirs, thus minimizing the diffusional mixing between reagents. We used 3,3ʹ-diaminobenzidine as a substrate that on enzymatic conversion produced a brown, persisting precipitate that could serve both as an immediate readout and a record for archival. Assay parameters such as volume, time and reagent concentrations were optimized extensively following standard protocols (see Extended Data Fig. 6 for examples) and will be reported elsewhere. The result can be visualized by the naked eye or quantified using a scanner or a smartphone integrated with a simple folded origami box to minimize light interference, with a sensitive, quantitative and reproducible output (Fig. 3c and Extended Data Figs. 7 and 8).
Automated microfluidic thrombin generation assay (TGA)
Routine coagulation tests (prothrombin time and activated partial thromboplastin time) are used as initial evaluation of haemostatic status. These tests terminate on clot formation and thus only inform on the initiation of clotting, whereas the coagulation cascade continues and generates 95% of total thrombin (the final enzyme in the coagulation cascade)25. The haemostatic capacity, expressed as the endogenous thrombin potential, can therefore not be fully evaluated by these tests26. Global coagulation assays, such as the TGA that provides the time-course of active thrombin concentration in clotting plasma, are better measures of haemostatic function. Peak height, shape and area under curve of the thrombin generation curve (also known as the thrombogram, Fig. 4a) can be determined and correlated to clinical phenotypes to investigate coagulation disorders, and measure the effect of anticoagulants27. The first TGA was introduced in the 1950s, and involves the activation of coagulation of blood or plasma, followed by a two-stage assay that requires the collection and mixing of subsamples with fibrinogen (or chromogenic substrates following their availability) at precisely timed intervals (for example, 1 min) over the course of 20 min or so, followed by the quantification of thrombin in each of them28,29. The labour intensity, strict timing requirements and risk of error are great obstacles to wider adoption and clinical use of TGAs-by-subsampling. The calibrated automated thrombogram (CAT) introduced in 2002 simplifies operations thanks to newly synthesized thrombin substrates, a calibration TGA using the patient sample spiked with reference material and mathematical extrapolation30.