Academic Article
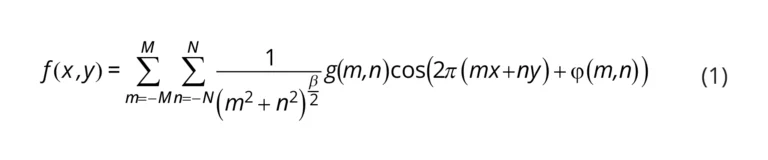
Room temperature roll-to-roll additive manufacturing of polydimethylsiloxane-based centrifugal microfluidic device for on-site isolation of riboneucleic acid from whole blood
by Trung Hoang, Han Truong, Jiyeon Han, Saebom Lee, Jihyeong Lee, Sajjan Parajuli, Jinkee Lee and Gyoujin Cho
Abstract: Polymer-based lab-on-a-disc (LoaD) devices for isolating ribonucleic acid (RNA) from whole blood samples have gained considerable attention for accurate biomedical analysis and point-of-care diagnostics. However, the mass production of these devices remains challenging in manufacturing cost and sustainability, primarily due to the utilization of a laser cutter or router computer numerical control (CNC) machine for engraving and cutting plastics in the conventional prototyping process. Herein, we reported the first energy-efficient room-temperature printing-imprinting integrated roll-to-roll manufacturing platform for mass production of a polydimethylsiloxane (PDMS)-based LoaD to on-site isolate ribonucleic acid (RNA) from undiluted blood samples. We significantly reduced energy consumption and eliminated thermal expansion variations between the mold, substrate, and resists by accelerating the PDMS curing time to less than 10 min at room temperature without using heat or ultraviolet radiation. The additive manufacturing technology was applied to fabricate a multi-depth flexible polymer mold that integrated macro (2 mm) and micro-sized (500 μm) features, which overcomes the economic and environmental challenges of conventional molding techniques. Our integrated R2R platform was enabled to print adhesion-promoting films at the first printing unit and continuously in-line imprint with a high replication accuracy (99%) for high-volume manufacturing of a new centrifugal microfluidic chip with an enhancement of mixing performance by integrating an efficient mixing chamber and serpentine micromixer. This research paved the way for scalable green manufacturing of large-volume polymer-based microfluidic devices, often required in real-world sample-driven analytical systems for clinical bioanalysis.
Keywords: room-temperature PDMS; centrifugal microfluidic; RNA extraction; roll-to-roll nanoimprint lithography; sustainable manufacturing
We kindly thank the researchers at Sungkyunkwan University for this collaboration, and for sharing the results obtained with their CADworks3D system.
1. Introduction
In the last two decades, microfluidic systems have evolved rapidly for numerous chemical, biomedical, biological, and environmental applications [[1], [2], [3], [4]]. Among those devices, lab-on-a-disc (LoaD) platforms are gaining much attraction for biomedical applications due to the ability to integrate rapid sample preparation stages such as the isolation of nucleic acids from large-volume whole blood samples [5] with assays. The LoaD devices offer significant advantages over other microfluidic systems, especially a reliable, controllable, and compact pumping mechanism that enables efficient mixing of reagents [6], rapid response time, and enhanced assay sensitivity. In this platform, fluid flow is driven by centrifugal pumping which involves minimal instrumentation by using only a simple and compact motor to generate the force. This approach eliminates the need for external interconnects and syringe pumps, thereby preventing contamination of the sample by the surrounding environment [7]. By combining the benefits of both microfluidics and centrifugal forces in a single device, the centrifugal microfluidic technology has been identified as a standard tool for mainstream diagnostics especially point-of-care in vitro diagnostics (IVD), and achieved significant commercial success [8].
A typical LoaD consists of a multilayer platform made from thermoplastics, such as polycarbonate (PC), poly (methyl methacrylate) (PMMA), polystyrene (PS), cycloolefin polymer (COP), assembled by adhesive or through hot embossing and injection molding methods [[9], [10], [11]], which is cost-effective for high-volume manufacturing process. These devices can also be fabricated through a laser or router computer numerical control (CNC) machine for engraving and cutting plastics, in conjunction with the utilization of plotter machines to cut the adhesive film [[12], [13], [14]]. However, for CNC-manufactured microfluidic devices, the surface becomes extremely rough, leading to slow and inaccurate fluid flow and bonding inhibition as well as non-specific binding which can negatively impact the performance of microfluidic devices. Also, the utilization of these subtractive manufacturing systems has been constrained by the capability of the cutting tools, making the fabrication process of micro-scale features even more expensive, lengthy, and complex, limiting the fabrication throughput, and presenting challenges for mass production ability.
Among polymer-based materials, polydimethylsiloxane (PDMS) has been widely used to fabricate microfluidic devices via soft lithography [[15], [16], [17], [18], [19]]. The use of PDMS in manufacturing LoaD devices has been considered as an alternative strategy to the CNC-based one due to its capability to reduce production costs, increase flexibility, facilitate ease of fabrication, and permit rapid prototyping without the use of harmful etching chemicals. The precursors required for preparing PDMS, comprising prepolymers and curing agents, are notable for their cost-effectiveness and widespread commercial availability. The fabrication process of PDMS-based microfluidic devices can be executed without the utilization of specialized cleanroom facilities enabling rapid prototyping of devices at a lower cost than what is feasible using silicon technology [16]. Moreover, the surface properties of PDMS can be easily tuned, enabling the ability to bond with many materials like glass and PDMS itself [20]. The optical transparency and gas permeability of PDMS-based microfluidic devices are ideal for numerous biomedical applications, particularly in optical detection methods and cell culture. Therefore, large-scale manufacturing methods of PDMS-based microfluidic devices have recently gained much importance in various research areas of science and engineering to bring the usages of these devices to practical clinical applications.
Roll-to-roll (R2R) nanoimprint lithography is considered as an up-and-coming alternative to traditional manufacturing methodologies, owing to its ability to achieve high-throughput production and thus facilitate its application at an industrial scale [21]. PDMS was first demonstrated to be R2R processable by Ahn and Guo [22] (2008) for sub-micrometre test structures on a polyethylene terephthalate (PET) substrate. Later, Hiltunen proposed R2R fabrication of integrated PDMS-paper microfluidics for molecular diagnostics [19]. However, both techniques relied on thermal imprinting to cure PDMS resist by heating the imprinting roll to a high temperature with a large amount of energy. This requires roll modifications with complex and expensive auxiliary systems such as piping networks to circulate the heating liquids, the pre-heating and heating units, cooling system as well as temperature monitoring and control system, which increase waste heat and energy consumption, consequently causing greenhouse gas emissions. Additionally, the mismatch in thermal expansion coefficients between the mold and substrate results in the generation of lateral strain, which degrades the quality of the imprinted patterns and the lifetime of the mold [23]. Also, the molds used in these proposed methods were limited to a micrometre scale, making them impossible to apply for the fabrication of large-volume LoaD which requires millimetre-scale thickness.
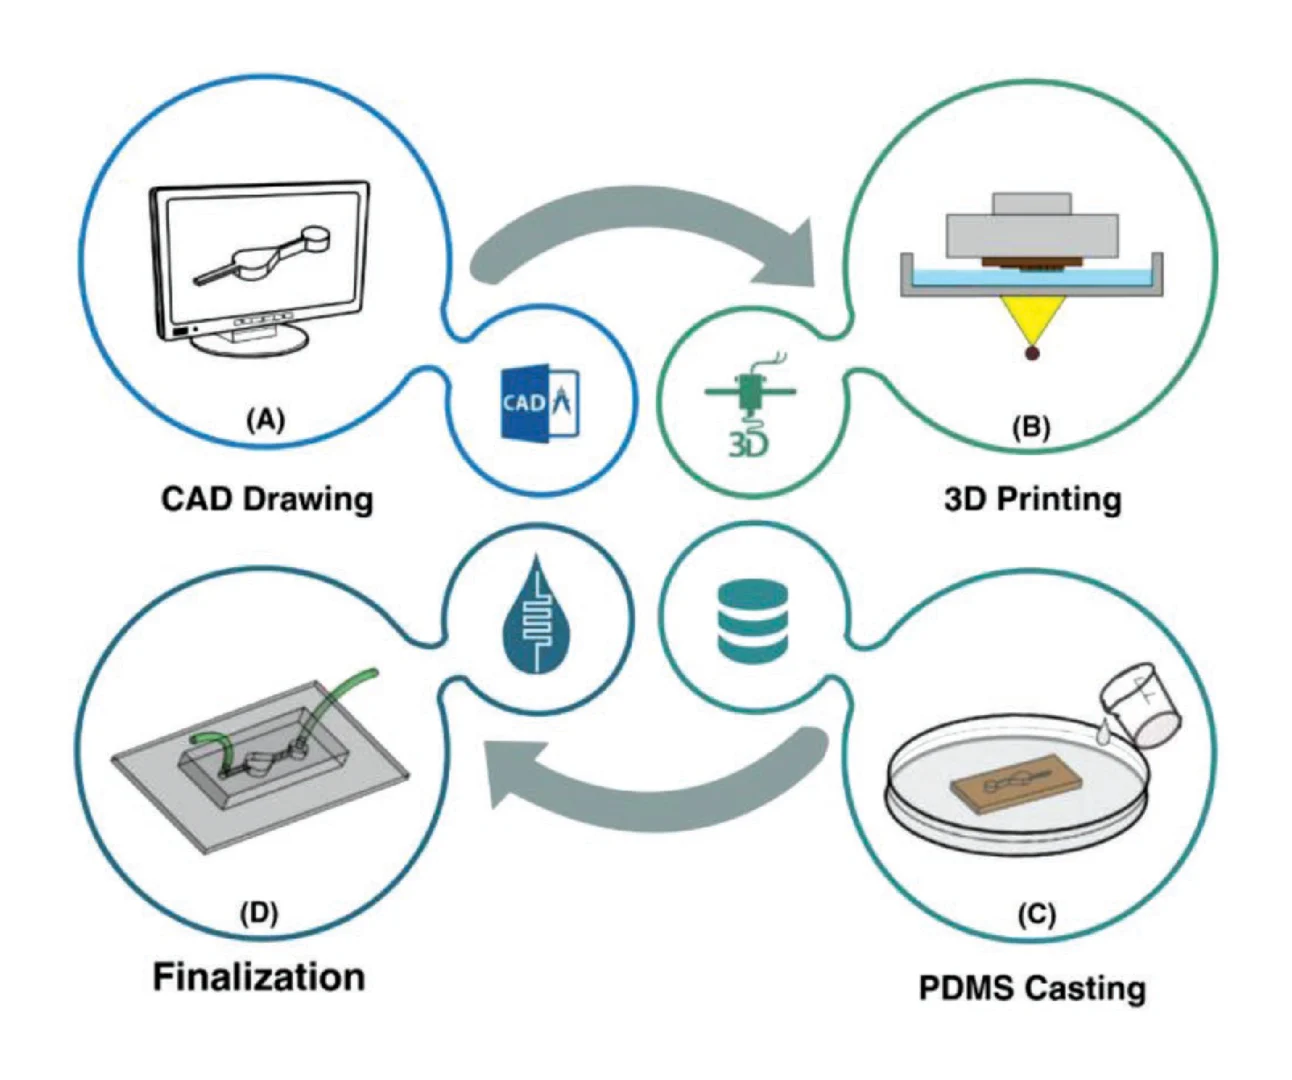
To overcome those issues mentioned above, we developed the first room-temperature printing – imprinting integrated roll-to-roll (R2R) in-line manufacturing platform for mass production of a PDMS-based LoaD for on-site RNA isolation from whole blood samples with low cost, less energy consumption, and less by-products. In this work, multi-depth master stamps were first fabricated by using a 3D printer, overcoming the challenges of conventional CNC-based and photolithographic molding technology. The large area flexible polymer shim was fabricated by using a rubber sheet to stick PDMS molds which were replicated from 3D-printed stamps. For mass producing the large volume LoaD by R2R technology, the printing unit was integrated in-line with an imprinting platform for coating an adhesion promoter onto PET substrate to facilitate the demolding process. We incorporated well-defined compounds into commercial PDMS Sylgard 184 formulations to accelerate the curing time of PDMS at room temperature enabling the success of a low-temperature R2R imprinting process which helped to reduce heat waste and energy consumption. Finally, as a proof-of-concept study, novel LoaD devices with a high enhancement of mixing performance were sustainably manufactured by our green R2R platform. For the first time, the utility of these R2R-manufactured LoaD devices was demonstrated by isolating RNA from undiluted blood samples.
2. Material and methods
2.1. Fabrication of negative 3D-printed mold
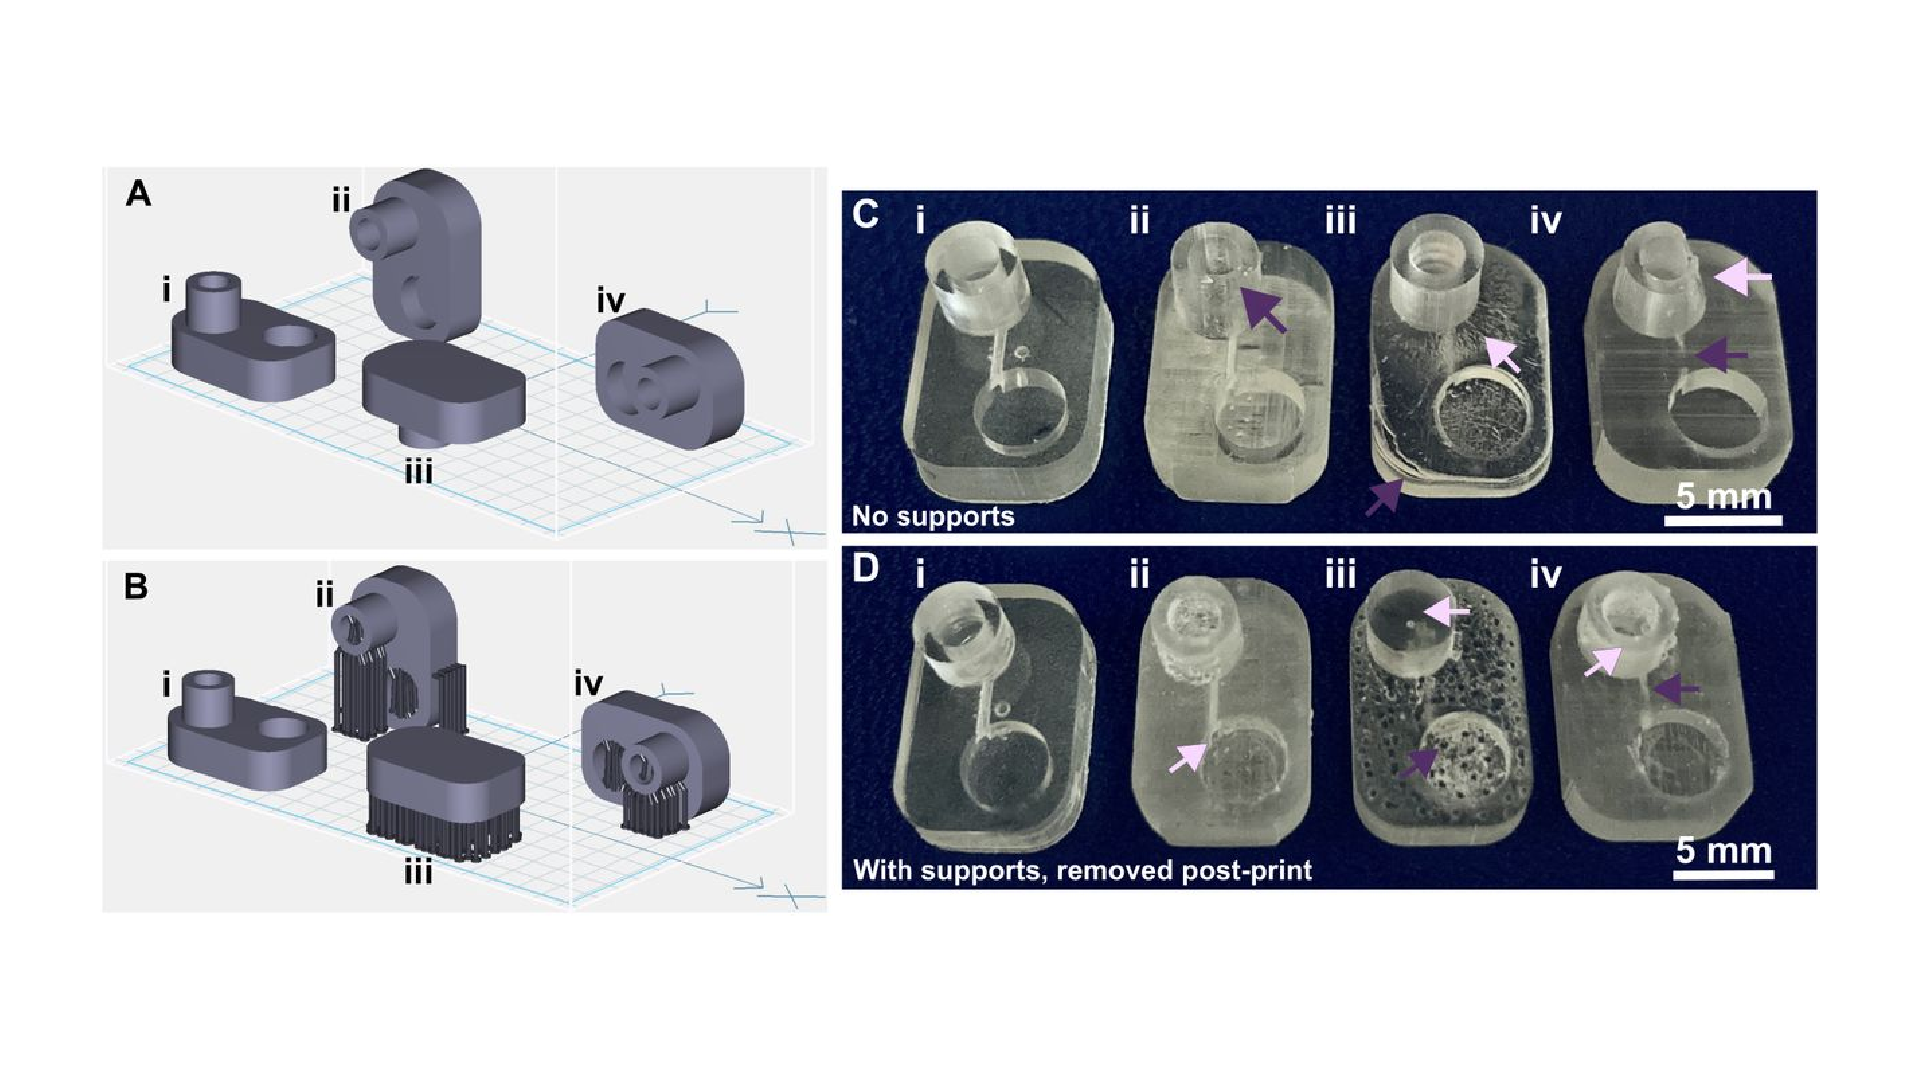
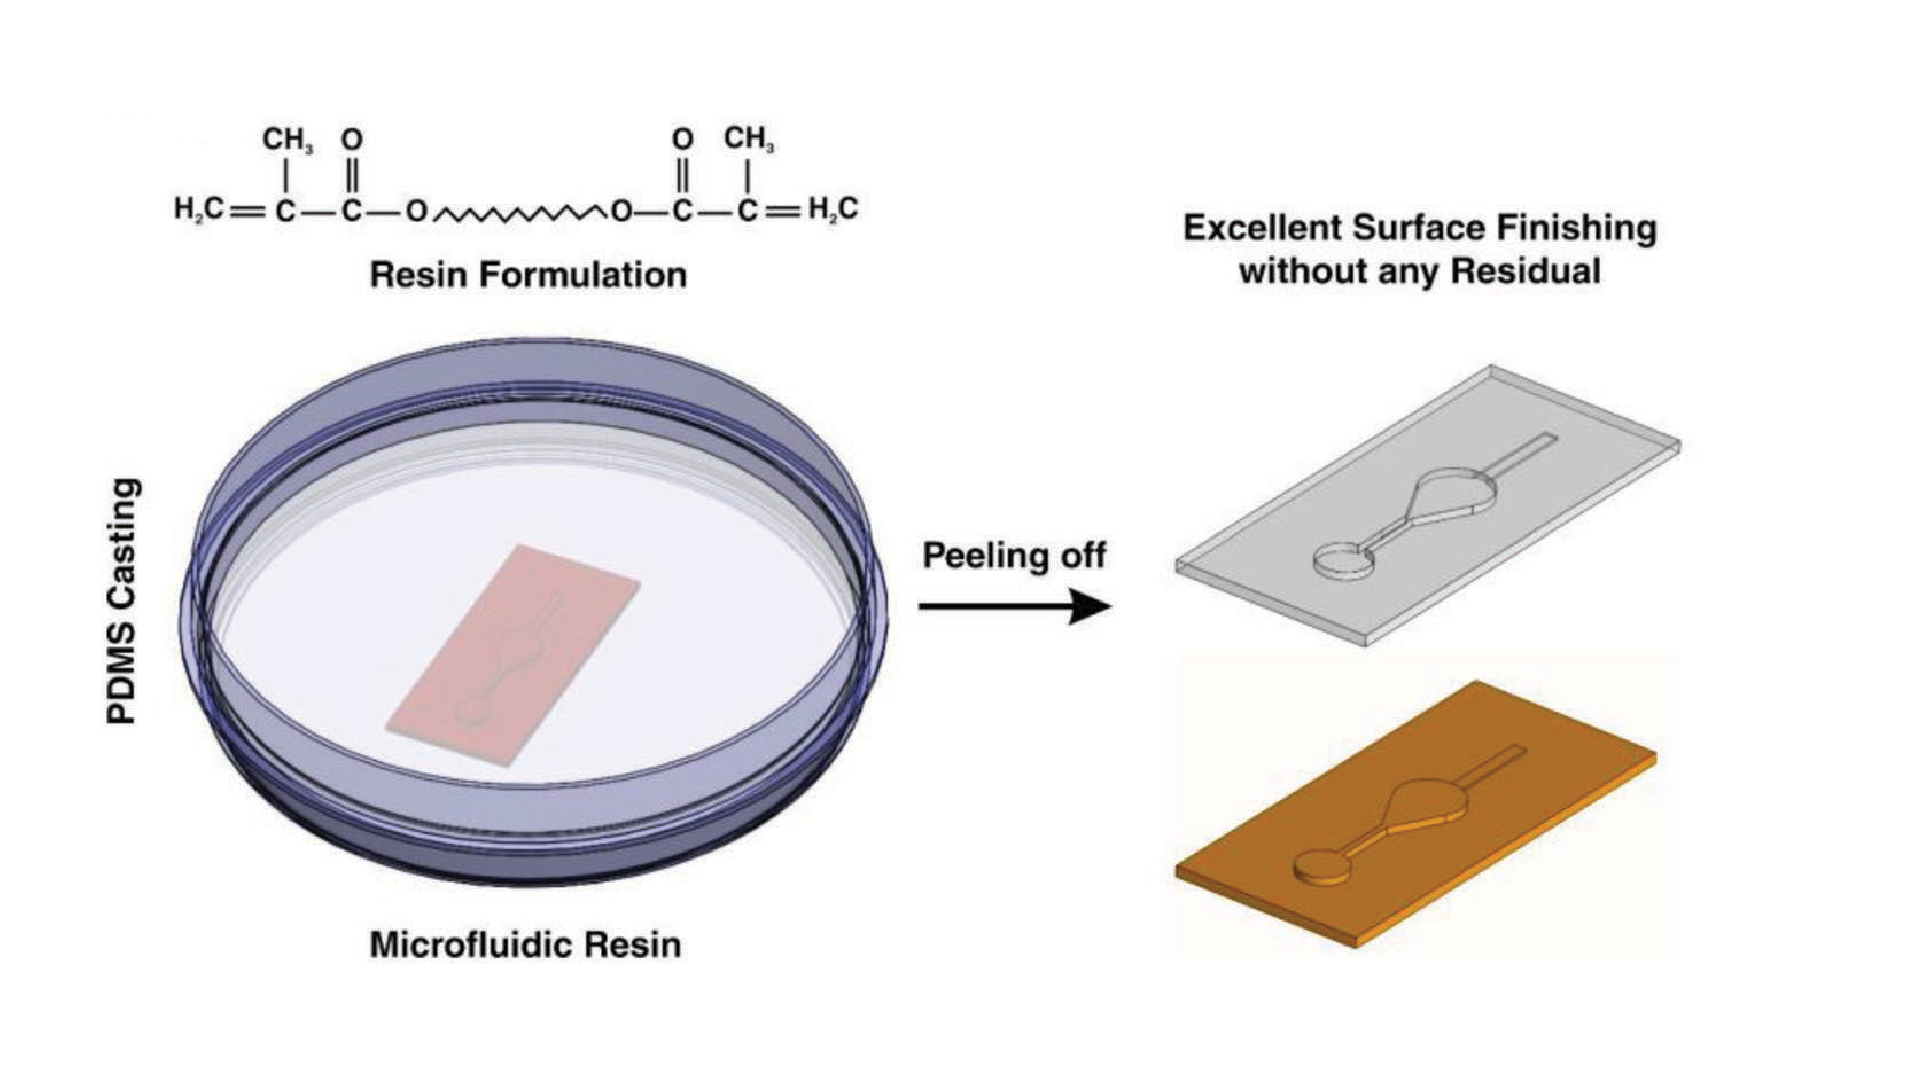
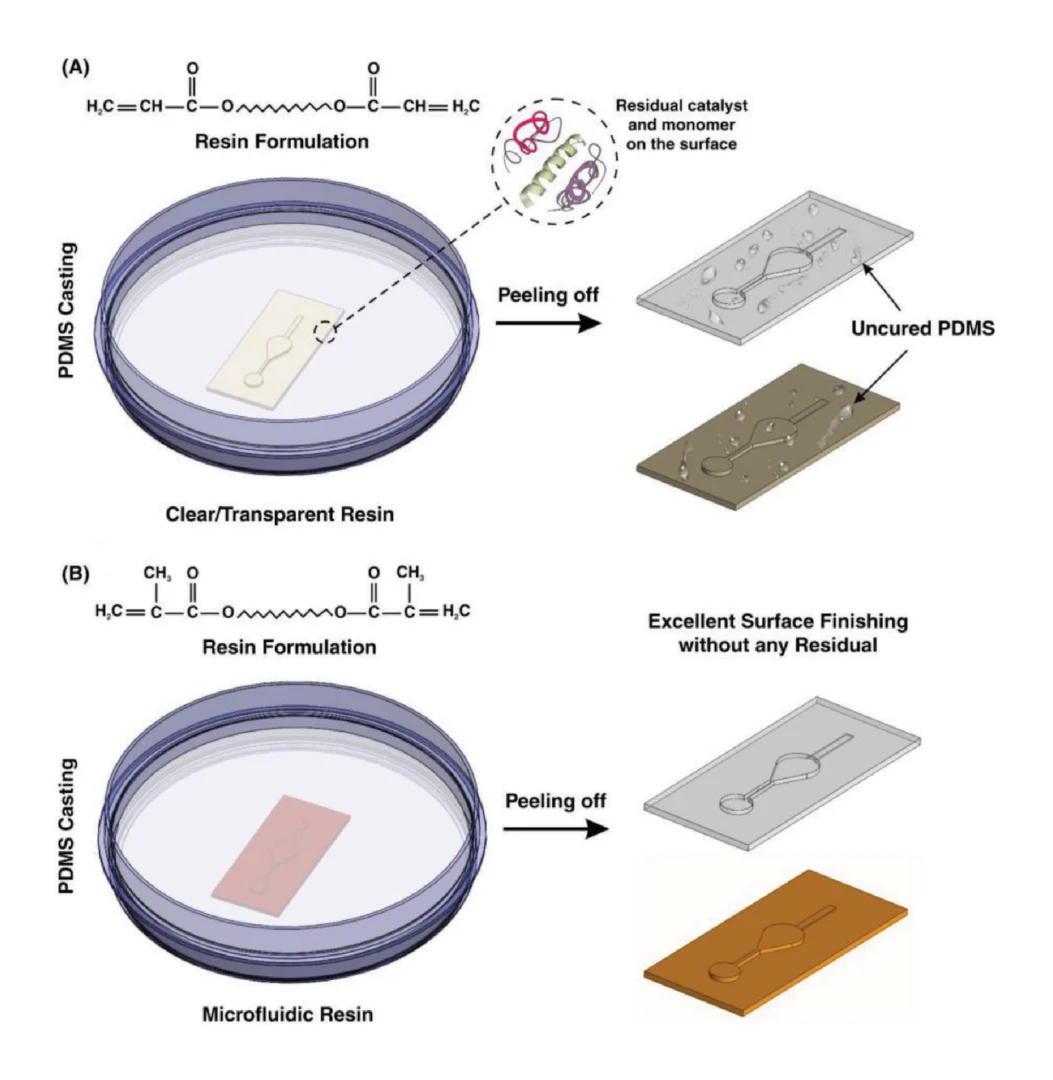
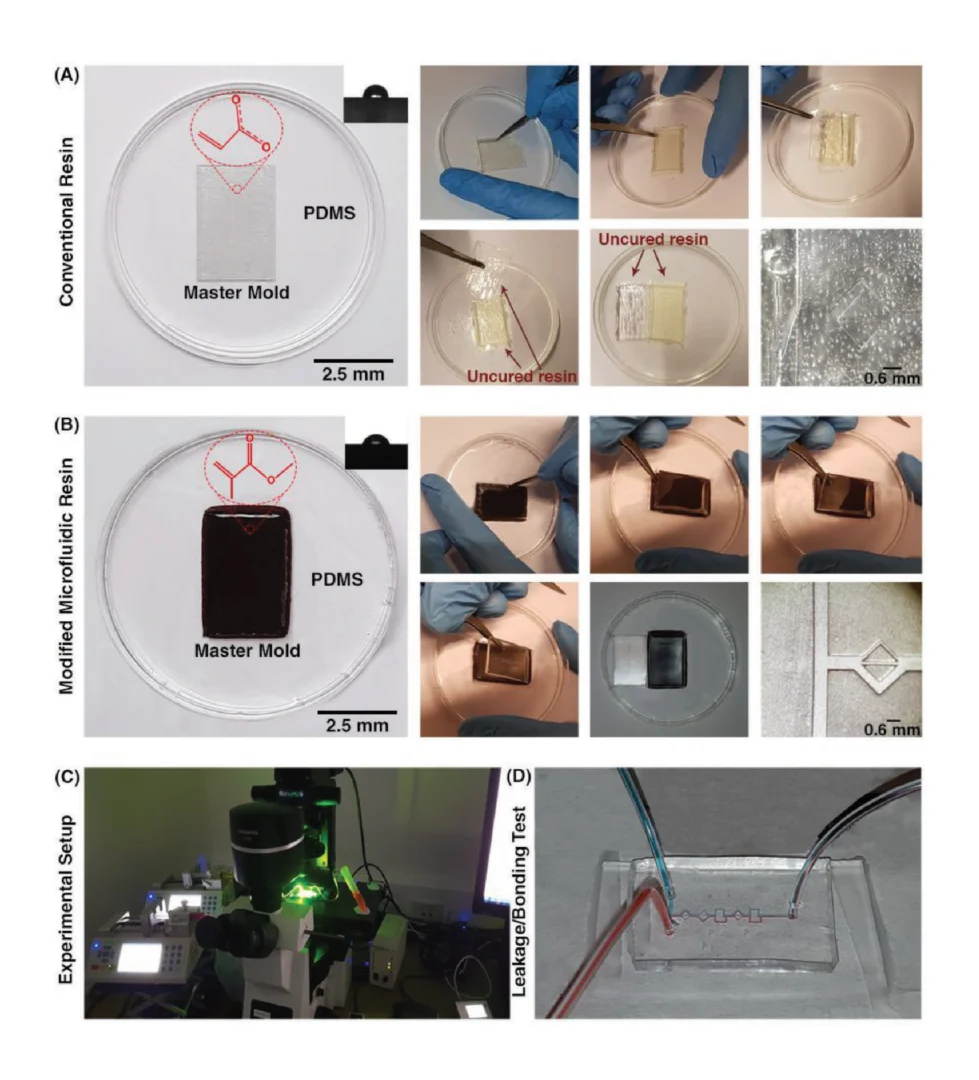
Our LoaD device comprises two layers: the designed patterns layer and a blank PDMS as a coverlid. The 3D model of the top part was designed by using SOLIDWORKS software, which was then exported as an STL file. We used the Utility Version 6.3.0t3 software to convert STL files into sliced files with appropriate layer heights. Printing options were optimized for high-resolution printing of mold features by using a 3D printer (PR110-385 from CADworks3D company) utilizing a 385 nm light source with a printing area of 110 × 62 × 120 mm and XY resolution of 40 μm. In this work, we printed all masters using the 3D printing protocol with the following parameters: a UV projection time per layer: 9.5 s and a z-axis resolution: 50 μm. It has been shown that 3D-printed templates interfere with the curing of PDMS due to uncured resin remaining on their surface [24]. Therefore, a post-print surface treatment technique is commonly necessary to overcome the aforementioned issues and prevent the adhesion of PDMS to the 3D-printed mold. A treatment method involving coating the template with a protective ink using airbrushing was reported by Comina et al. [25]. The group claimed this technique requires much effort for achieving optimal results. Ho et al. proposed another complicated surface treatment method for 3D printed templates, including heating, plasma treatment, and surface silanization [24]. However, cracks were formed in the template during the heating process. To avoid these time-consuming, nonreplicable, and ineffective surface treatment methods, we fabricated master molds directly via the DLP 3D printing method utilizing a novel resin formulated by Creative CADworks company (CCW Master Mold for PDMS devices), composed of methacrylated oligomers and monomers. After removing printed molds from the picker, they were subjected to a thorough rinsing procedure utilizing isopropanol. Subsequently, an air nozzle was employed to eliminate residual resin from edges and within extremely fine features. Finally, we postcured the molds by exposing each part to UV light at a wavelength of 405 ± 5 nm within a curing chamber, and then, the resulting molds were employed in our imprinting works.
2.2. Fabrication of positive PDMS mold
To fabricate positive PDMS mold, we prepared a mixture including PDMS base and curing agent in the ratio (W/W) of 10:1 (Sylgard 184 from Dow Corning, MI, USA). The mixture was mixed and defoamed with a centrifugal mixer (Thinky Mixer ARE-310) for 3 and 2 min, respectively, and then poured onto the 3D-printed molds without undergoing any surface treatment process. Later, we cured it in the oven for 4 h at 60 °C. Subsequently, the cured PDMS was carefully detached from the molds and cleaned thoroughly with isopropyl alcohol (IPA) and ethanol at least three times, followed by air drying between each wash. To be used as the mold for the R2R imprinting process, we applied a conformal coating of parylene C which serves as an anti-adhesion layer for demoulding these positive PDMS replicas [26]. Finally, a flexo plate with 5 mm thickness was cut with precise squares, used as the substrate for inserting PDMS positive molds, and wrapped to form a sleeve for preparing the imprinting cylinder.
2.3. PDMS formulations for R2R imprinting process
We formulated a new recipe for fast curable PDMS at room temperature (named Room-Temp PDMS in this paper) by adding compounds (the Ashby–Karstedt catalyst and tetrakis (dimethylsiloxy) silane) into commercial PDMS Sylgard 184 formulations [27]. SYLGARD™ 184 Silicone Elastomer and curing agent were supplied by Dow. Ashby–Karstedt catalyst (platinumcyclovinylmethyl-siloxane complex; 2 % Pt (0) in cyclomethylvinylsiloxanes) and Tetrakis (dimethylsiloxy) silane (TDS) were supplied by Gelest. We used a ratio of 10:1 (w/w) for the elastomer and curing agent to make the standard Sylgard 184 framework. In this study, these compounds were always added following the optimized recipe in exact order: (1) TDS 2 wt%; (2) Elastomer base 88.95 wt%; (3) Curing Agent 8.9 wt%; and (4) Ashby–Karstedt catalyst 0.15 wt%. After all the chemicals had been added, we placed the mixture in Reactor-Ready included circulator Huber Ministat 230, both were supplied by Radleys company (Fig. S8) for continuous mixing at 500 rpm and cooling at −15 °C to prolong the lifetime of PDMS for the imprinting process. After mixing for 1 h, we turned off the mixer and set the reactor at a vacuum of 0.2 psi for degassing in 1 h meanwhile maintaining cooling during the whole process. For comparison, we also prepared the standard PDMS Sylgard 184 as control samples (named Sylgard 184 in this paper) and the reference samples (named Vinyl-terminated PDMS in this paper) by optimizing the recipe of a fast, thermal-curable liquid resist [28] based on a modified PDMS. The formulation for this reference sample consists of three components: vinyl-terminated PDMS was supplied by Gelest, poly (dimethylsiloxane-co-methylhydrosiloxane) trimethylsilyl terminated which acts as a crosslinker and platinum (0)-1,3- divinyl-1,1,3,3-tetramethyldisiloxane complex solution as a catalyst, both were supplied by Sigma-Aldrich. In our optimized recipe, we mixed a ratio of 5:1 (w/w) for the vinyl-terminated PDMS and crosslinker, then added Pt catalyst into the mixer at a concentration of 470 ppm. This formulation effectively accelerated the curing time of this PDMS-based resist at room temperature, making it possible to be used for the R2R imprinting process.
2.4. Roll-to-roll imprinting process and chip assembly
The replication by the R2R imprinting process was conducted at room temperature through an imprinting unit as illustrated in Fig. S1. First, we treated a roll of 150 mm wide PET substrate with an adhesion promoter (Wacker Primer G790) by gravure printing method with a speed of 3 mm/s for five layers then dried in line at room temperature. The coated PET substrate remained as transparent as the original one, as shown in Fig. S2a. The premixed PDMS was deposited to the gap between the imprinting roll and pressure roll during the R2R imprinting process. We operated the process at room temperature with optimized pressure by testing 1 to 10 kgf/cm2 under an imprinting speed of 0.3 mm/s. After coming out from the imprinting unit, imprinted chips on the PET substrate were collected at the rewind roller and were applied to a cutting process for making single devices. The coverlids were simply fabricated by pouring our room-temperature PDMS into a 3D-printed square mold with a dimension of 55 × 55 mm, resulting in unstructured PDMS layers with a uniform thickness of 1 mm. The inlets and outlets for each chamber were manually punched. After that, a 3 mm diameter circular disc magnet which was supplied by First4Magnets, was preloaded into the mixing chamber of each device, and lids were then bonded onto the imprinted layer with a plasma treatment method.
2.5. Replication accuracy and material characterization
Replication accuracy. Dimensional analysis of the 3D printed mold, PDMS mold, and the R2R imprinted LoaD was performed with an industrial microscope Olympus BX53M.
Optical properties measurement. Autofluorescence measurements of three types of PDMS and glass were conducted by using a Nikon Eclipse Ti2 microscope with 4 different excitation wavelengths. The optical transmittance was measured on all three PDMS types: Sylgard 184, Modified Vinyl-terminated PDMS, and Modified Sylgard 184 using a complete setup of a 508 PV™ UV–visible–NIR Spectrophotometer integrated with a bright field microscope Olympus BX53M. For both measurements, we prepared 3 samples for each PDMS by pouring uncured PDMS into the circle Petri dish with a diameter of 55 mm with a uniform thickness of 2 mm and curing at 80 °C. All the samples were cleaned by sonicating in ethanol for 30 min and then dried with a nitrogen gun before analysis. To check the discoloration phenomenon of these materials, we prepared 5 samples for each type of PDMS in the same way as mentioned above, but all were cured at room temperature. After fully curing all samples, we aged them thermally in 5 isothermal ovens respectively at 20 °C, 40 °C, 60 °C, 80 °C, and 100 °C for 1 h before analyzing.
Contact angle measurements. We measured the static contact angle for each type of PDMS by using a Drop Shape Analyzer (DSA100) from Krüss. Measurements were conducted using an automated drop dispenser and deposition device to dispense a 2 μl drop of deionized (DI) water on the material surface. The static contact angle was calculated using computer software.
Mechanical characterization techniques. Tensile strength tests were conducted using the Instron Electropuls E3000 testing system. All samples for three types of PDMS were prepared following ASTM D-412 standards which were cut into dumbbell shapes, referred to as dogbone, using a type-D specimen die. The samples were put into the uniaxial grips and dragged at a speed of 3.84 mm/s until they reached a breakpoint [27]. We performed the tests on five trials for each sample then the engineering stress and strain were reported as averages and corresponding standard deviations.
2.6. Nucleic acid design and reagents
Complete genomes of SARS-CoV-2 Wuhan wildtypes (accession MN908947.3) were retrieved from NCBI (https://www.ncbi.-nlm.nih.gov/). Forward Primer -ACAGGTACGTTAATAGTTAATAGCGT and Reverse Primer -ATATTGCAGCAGTACGCACACA were purchased from Cosmogenetech Inc., (Seoul, Korea). The experiment used SARS-CoV-2 mRNA spiked in human whole blood (Innovative Research,USA) for further analysis. RNA purification reagents were purchased from MagListo 5 M viral DNA/RNA extraction (Bioneer). The buffer solutions (proteinase K, virus binding buffer (VB)), washing buffer (VWM1, RWA2, and WE buffer), elution buffer (ER buffer), magnetic nanobead (MNPs) were preloaded into the chip with the volume: 20 μl proteinase K, 200 μl VB, 400 μl absolute ethanol, 50 μl magnetic nanobead, 500 μl washing buffer, 100 μl ER buffer. 200 μl of blood was added at the beginning of the operation. Polymerase chain reaction (PCR) was performed using the following protocol: reverse transcription (42 °C for 5 min, 95 °C for 10 s), PCR test (40 cycles of 95 °C for 5 s, 60 °C for 30 s), melting curve analysis (95 °C for 0 s, 65 °C for 15 s, 95 °C for 0 s) with 20 μl of final PCR volume (One Step TB Green® PrimeScript™ RT-PCR Kit II (Perfect Real Time) (Takara Bio, Tokyo, Japan).
In our LoaD devices, we utilized ferro-wax valves which were made by mixing paraffin wax (327,204, Sigma-Aldrich, Inc., St. Louis, MO, USA) with Ferrofluid (EFH1, 60 cc, Ferrotec, Santa Clara, CA, USA) in the ratio of 1:1 b y mass and stirring the mixture at 65 °C on a hotplate for 12h.
3. Results
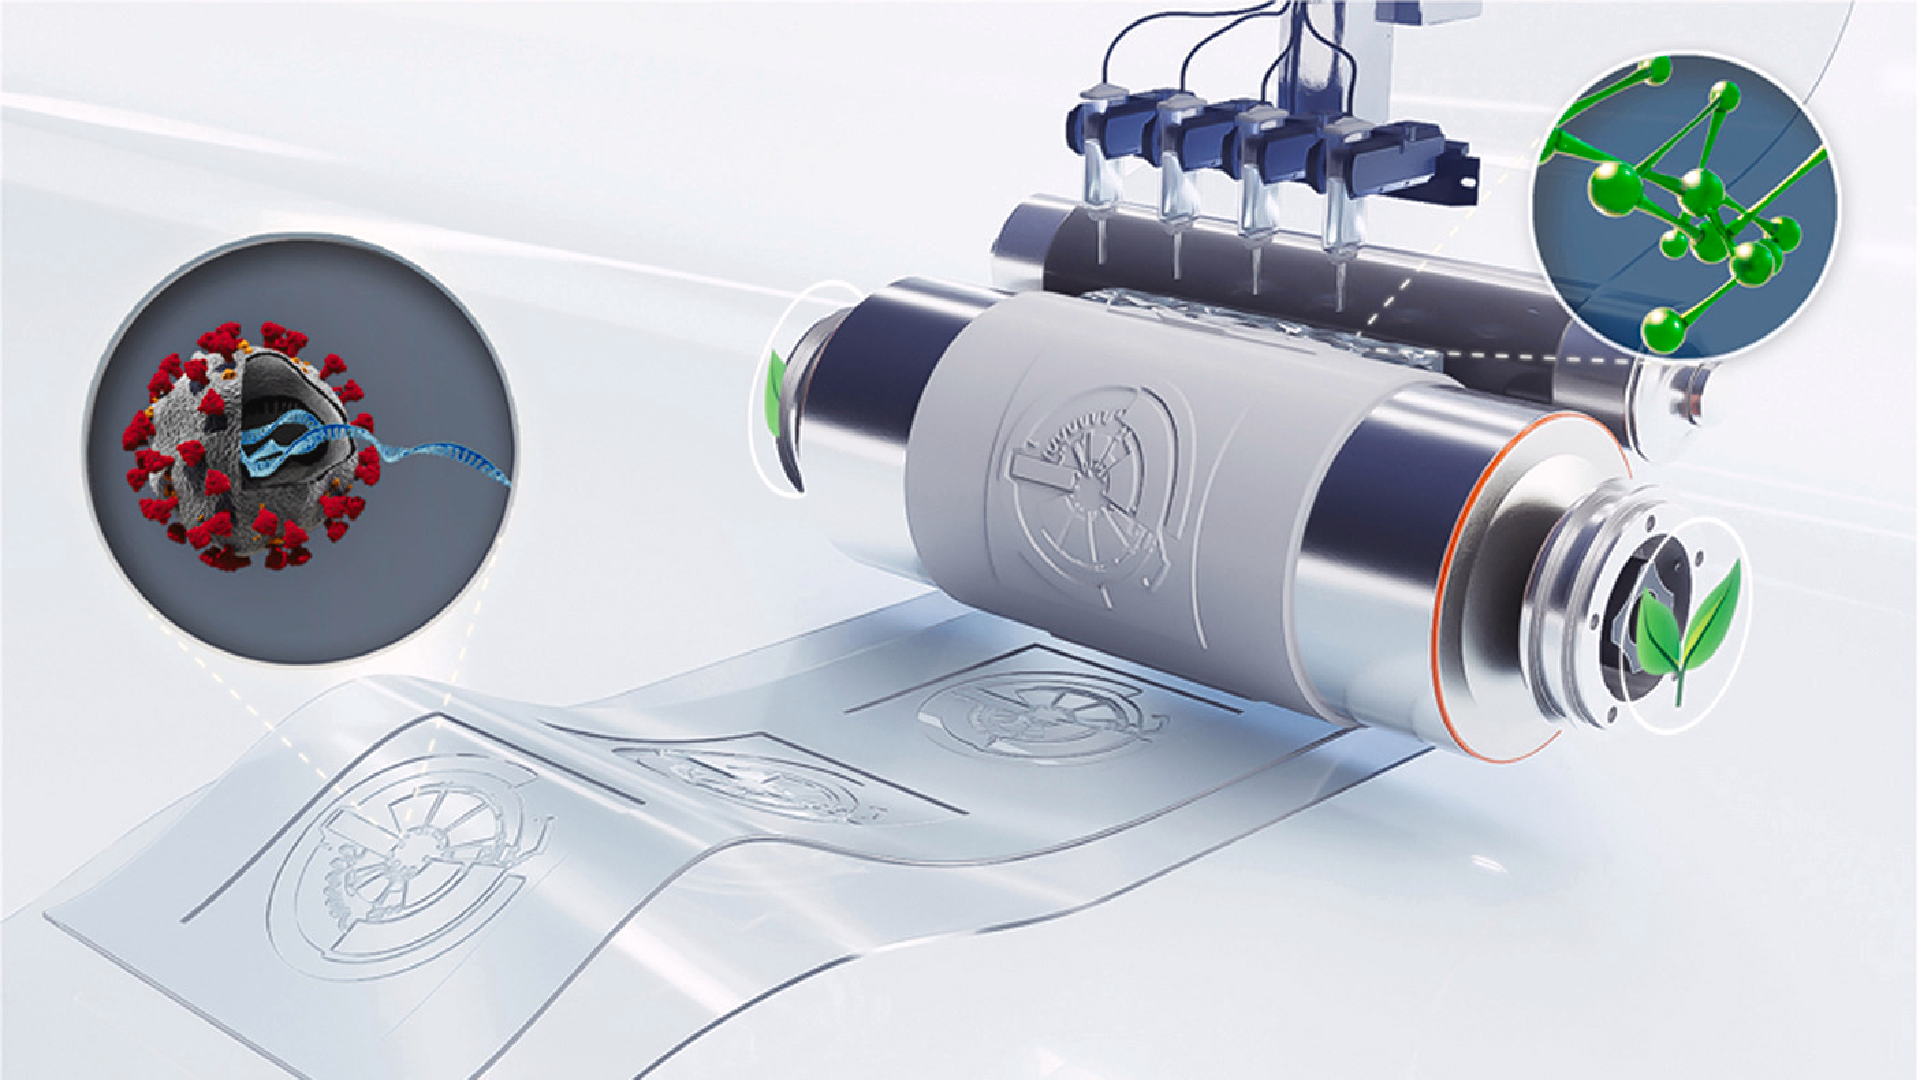
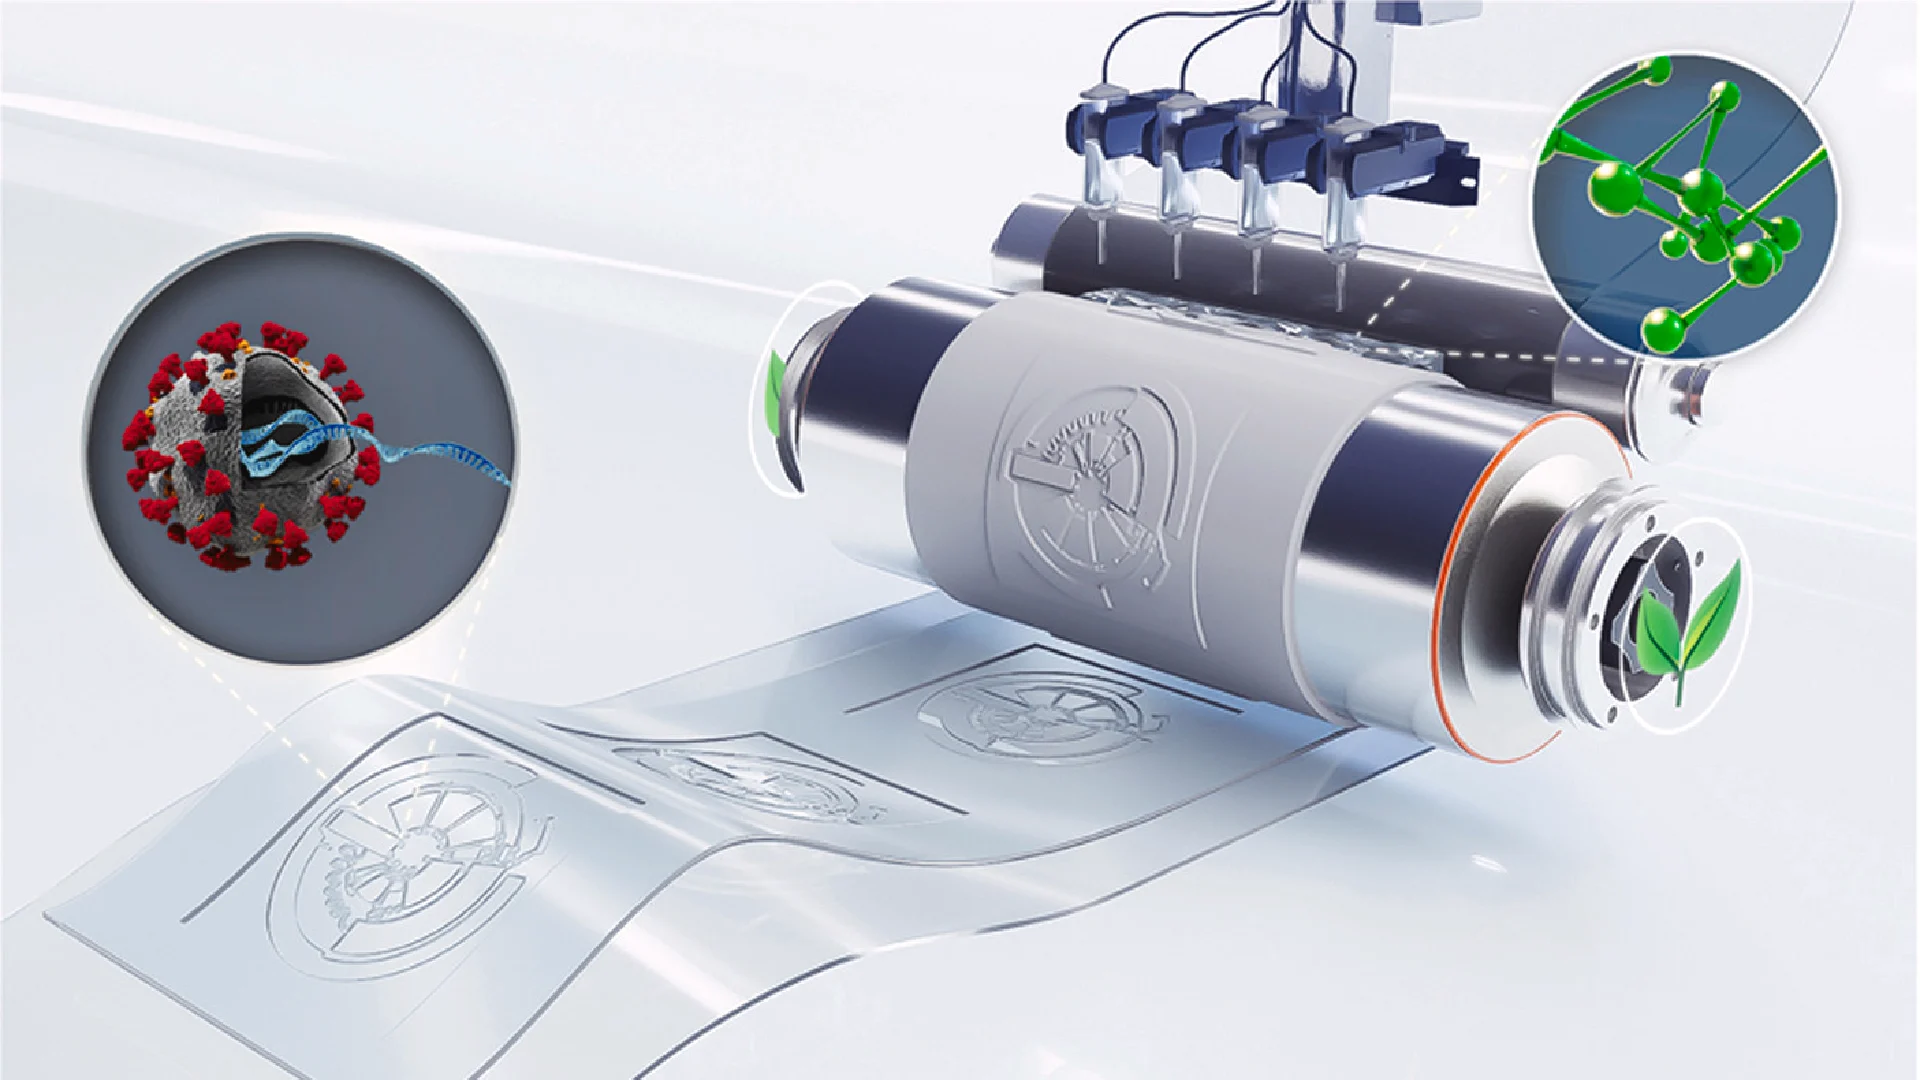
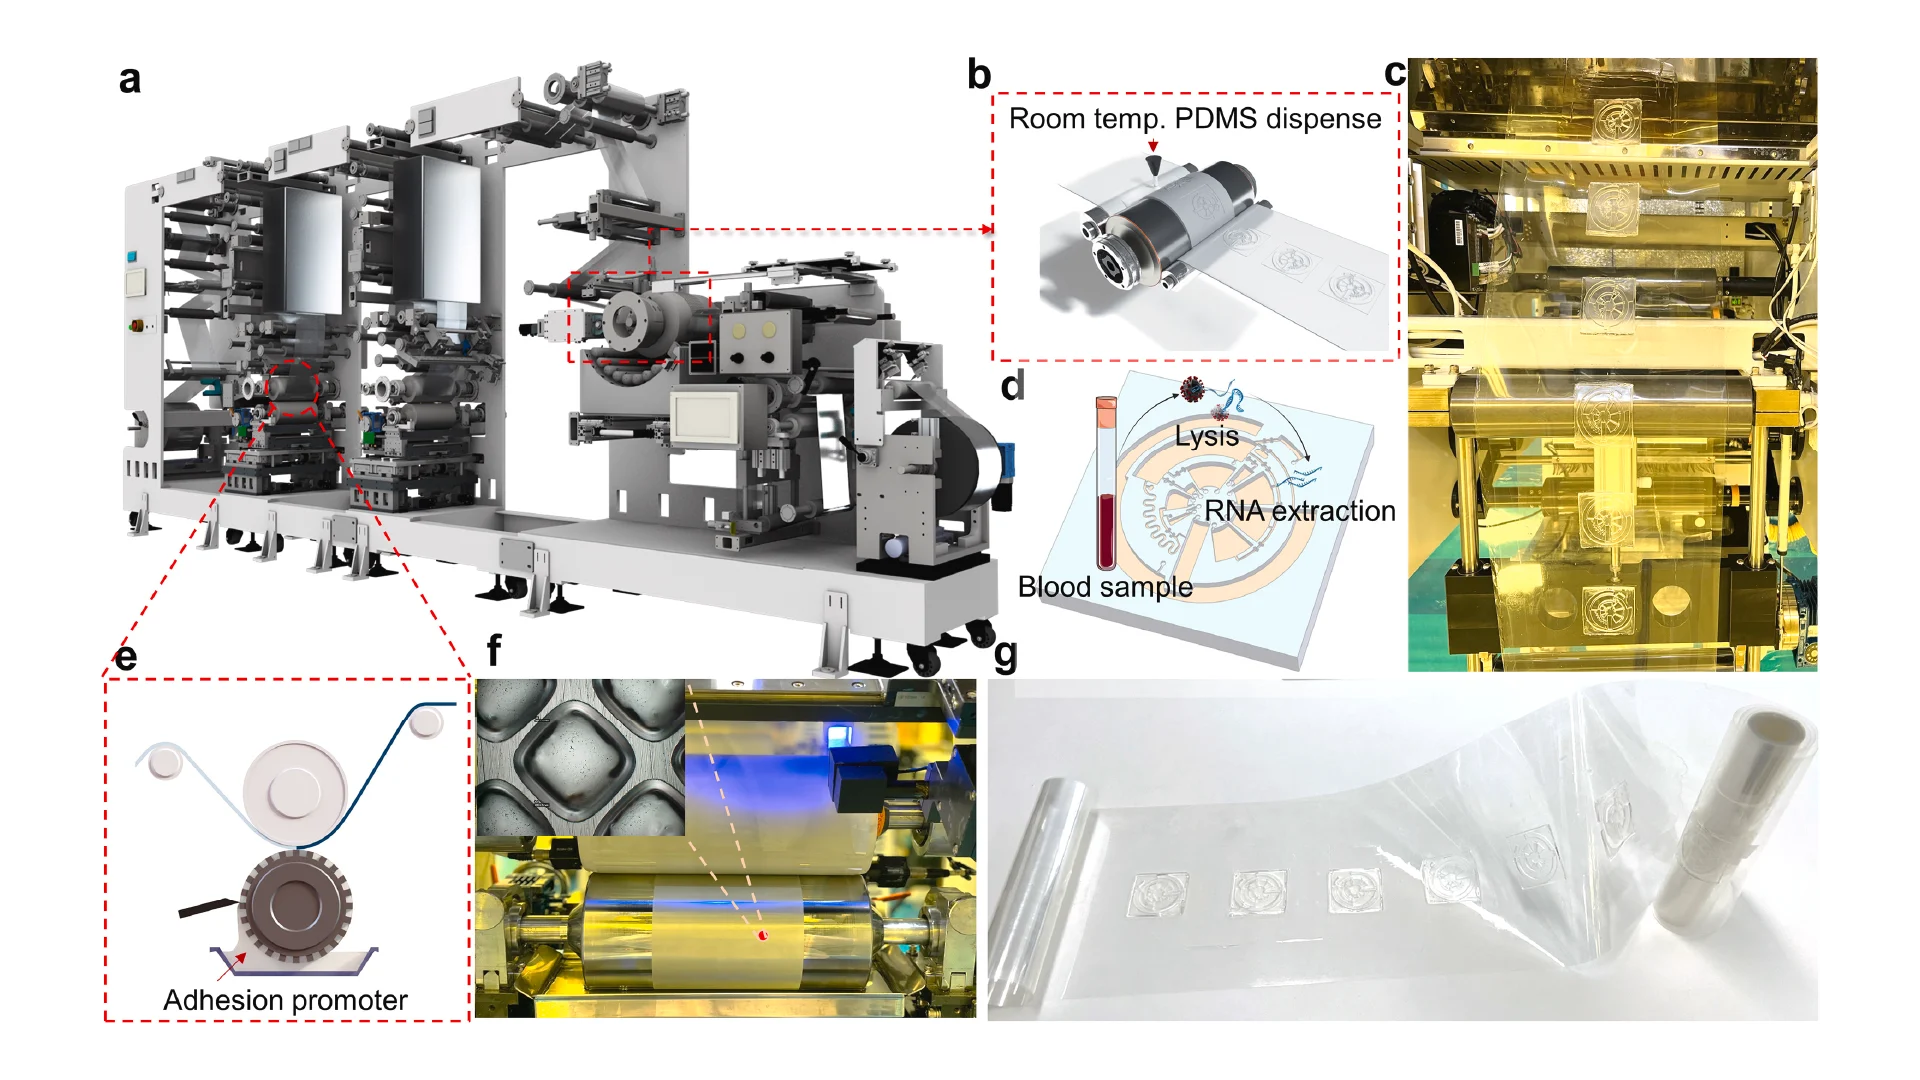
We developed the first sustainable R2R additive manufacturing platform for fabricating PDMS-based centrifugal microfluidic devices at room temperature without using heat and light sources that minimize the emission of greenhouse gas and hazardous by-products (Fig. 1). In this work, we used the continuous in-line printing and imprinting units of our R2R system, illustrated in Fig. 1a. By utilizing additive manufacturing, we introduced sustainable fabrication techniques for a deep-depth flexible shim that addressed the issues of traditional molding technologies (Fig. 1b). As illustrated in Fig. 1c, LoaD devices were successfully manufactured at ambient condition by using the new fast-room temperature-curing PDMS based on Sylgard 184 to eliminate the need for heat and light sources which are often used in conventional R2R imprinting process. The process of on-chip isolation of RNA from whole blood using our R2R imprinted LoaD was illustrated in Fig. 1d. Before the imprinting process, the PET substrate was uniformly treated by R2R gravure printing unit with an adhesion promoter that effectively assisted the demoulding of structures with a large thickness (∼2 mm) (Fig. 1e and f). Finally, we successfully demonstrated the high throughput and sustainable manufacturing platform for producing the LoaD devices (Fig. 1g).
3.1. Design and 3D printing of the centrifugal microfluidic devices
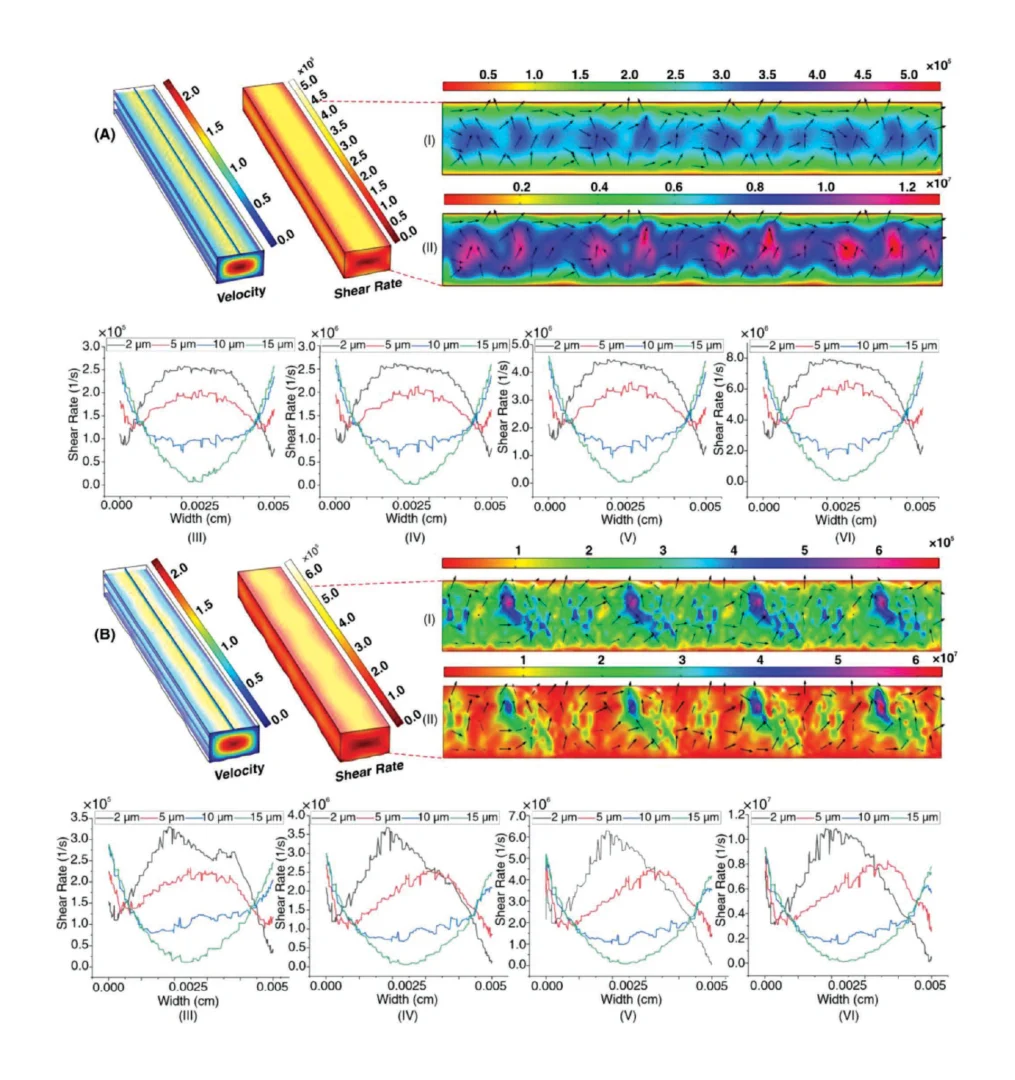
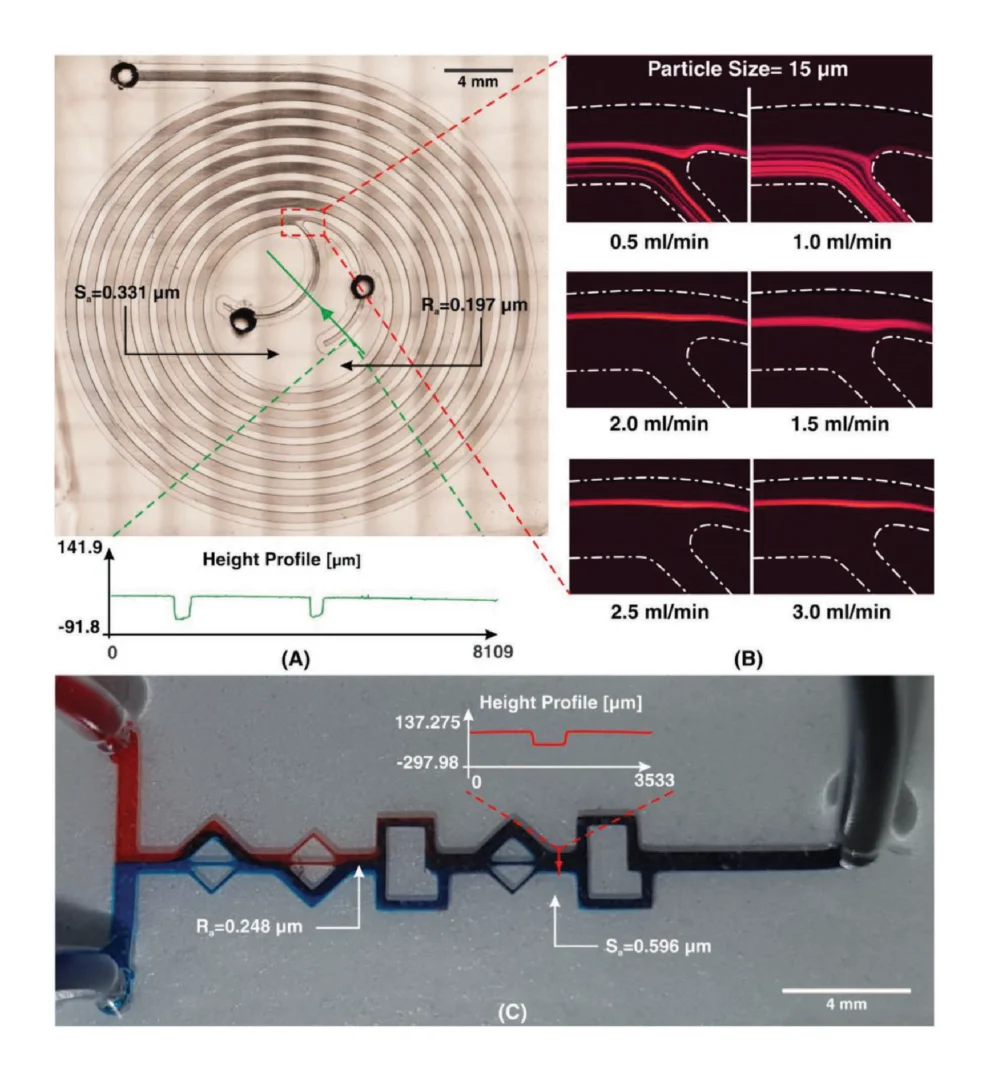
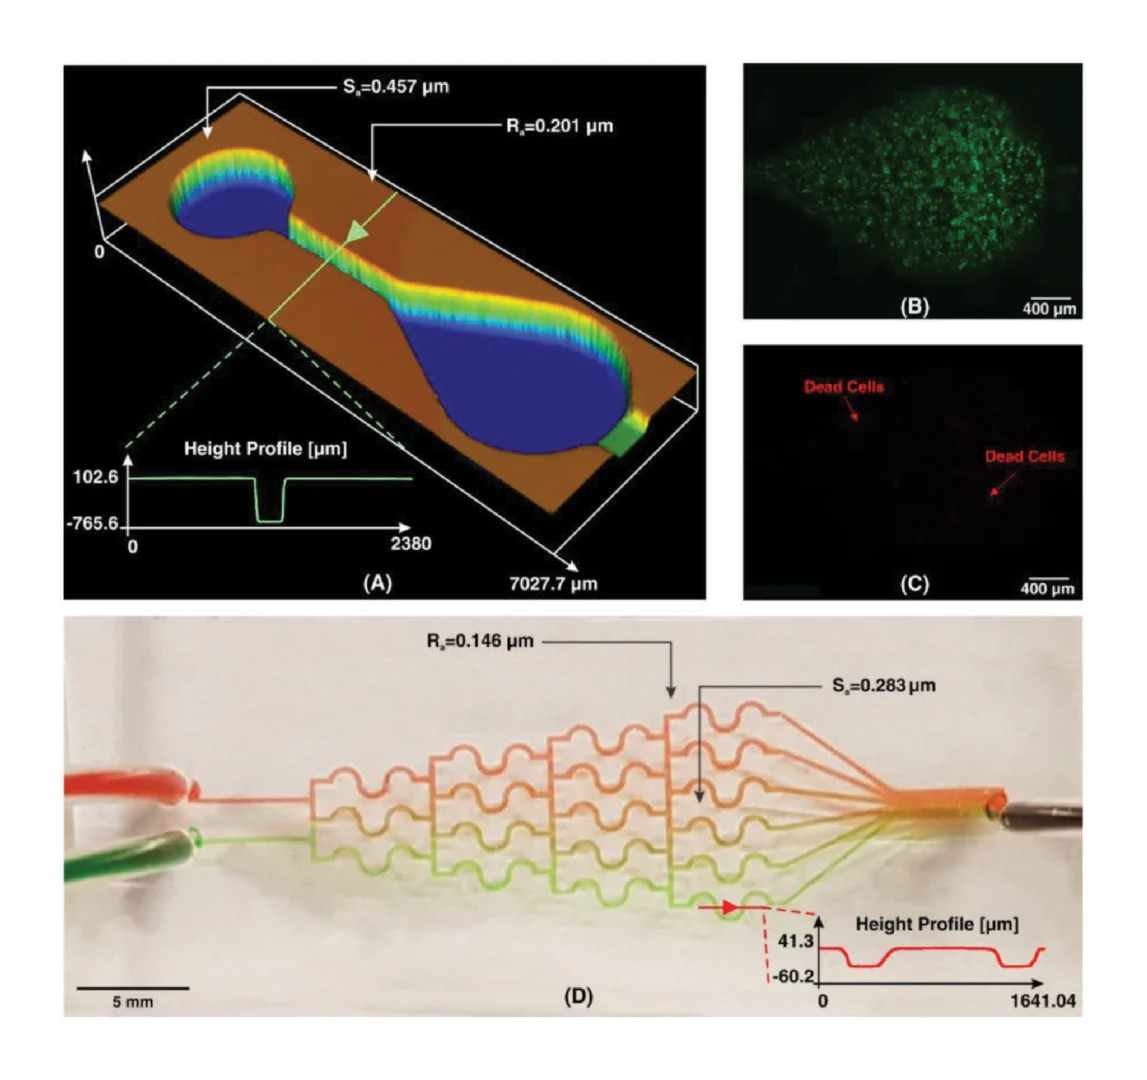
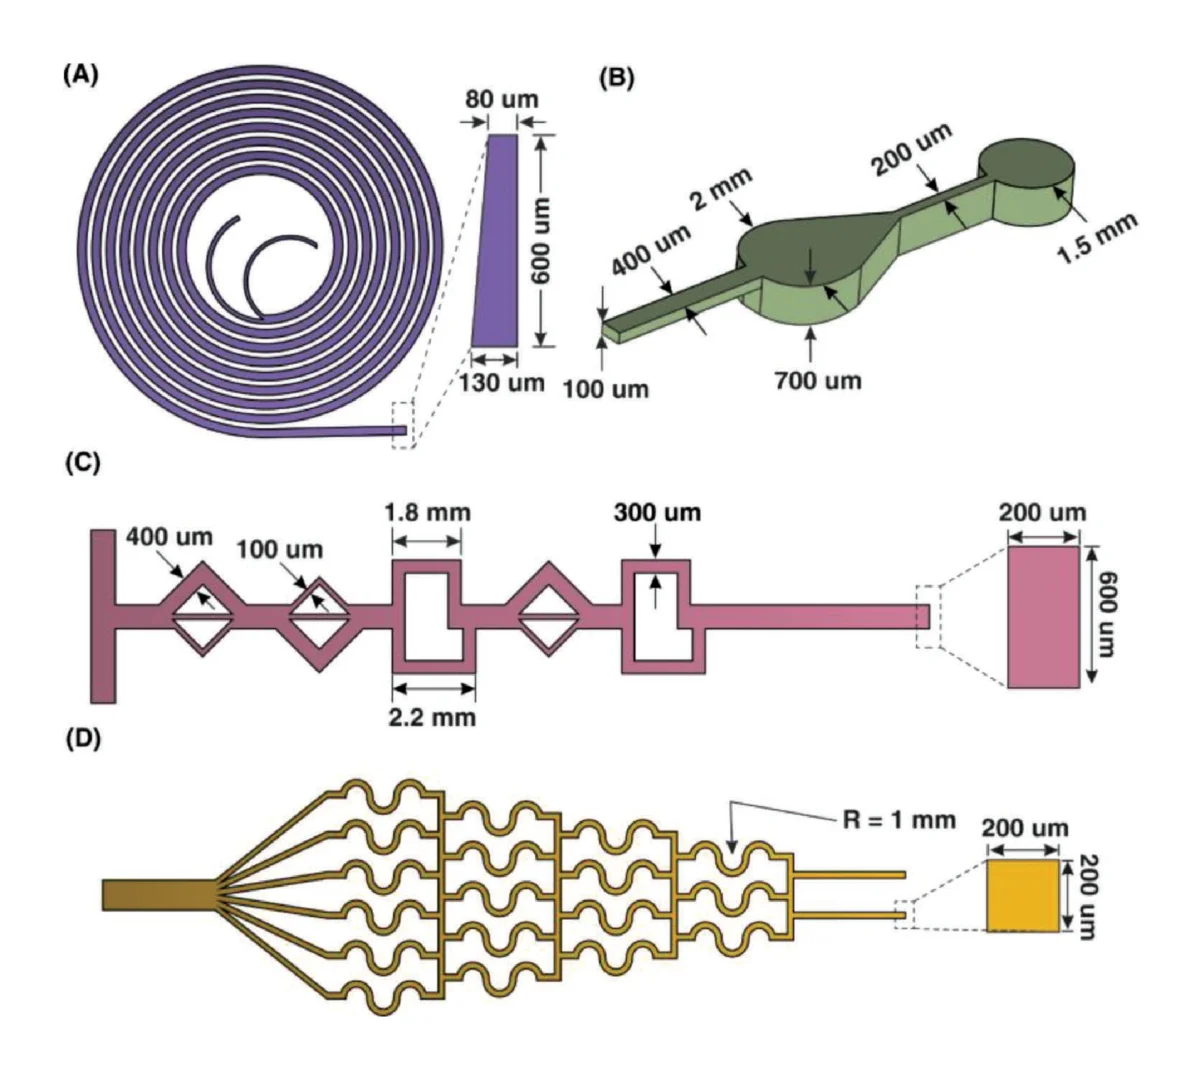
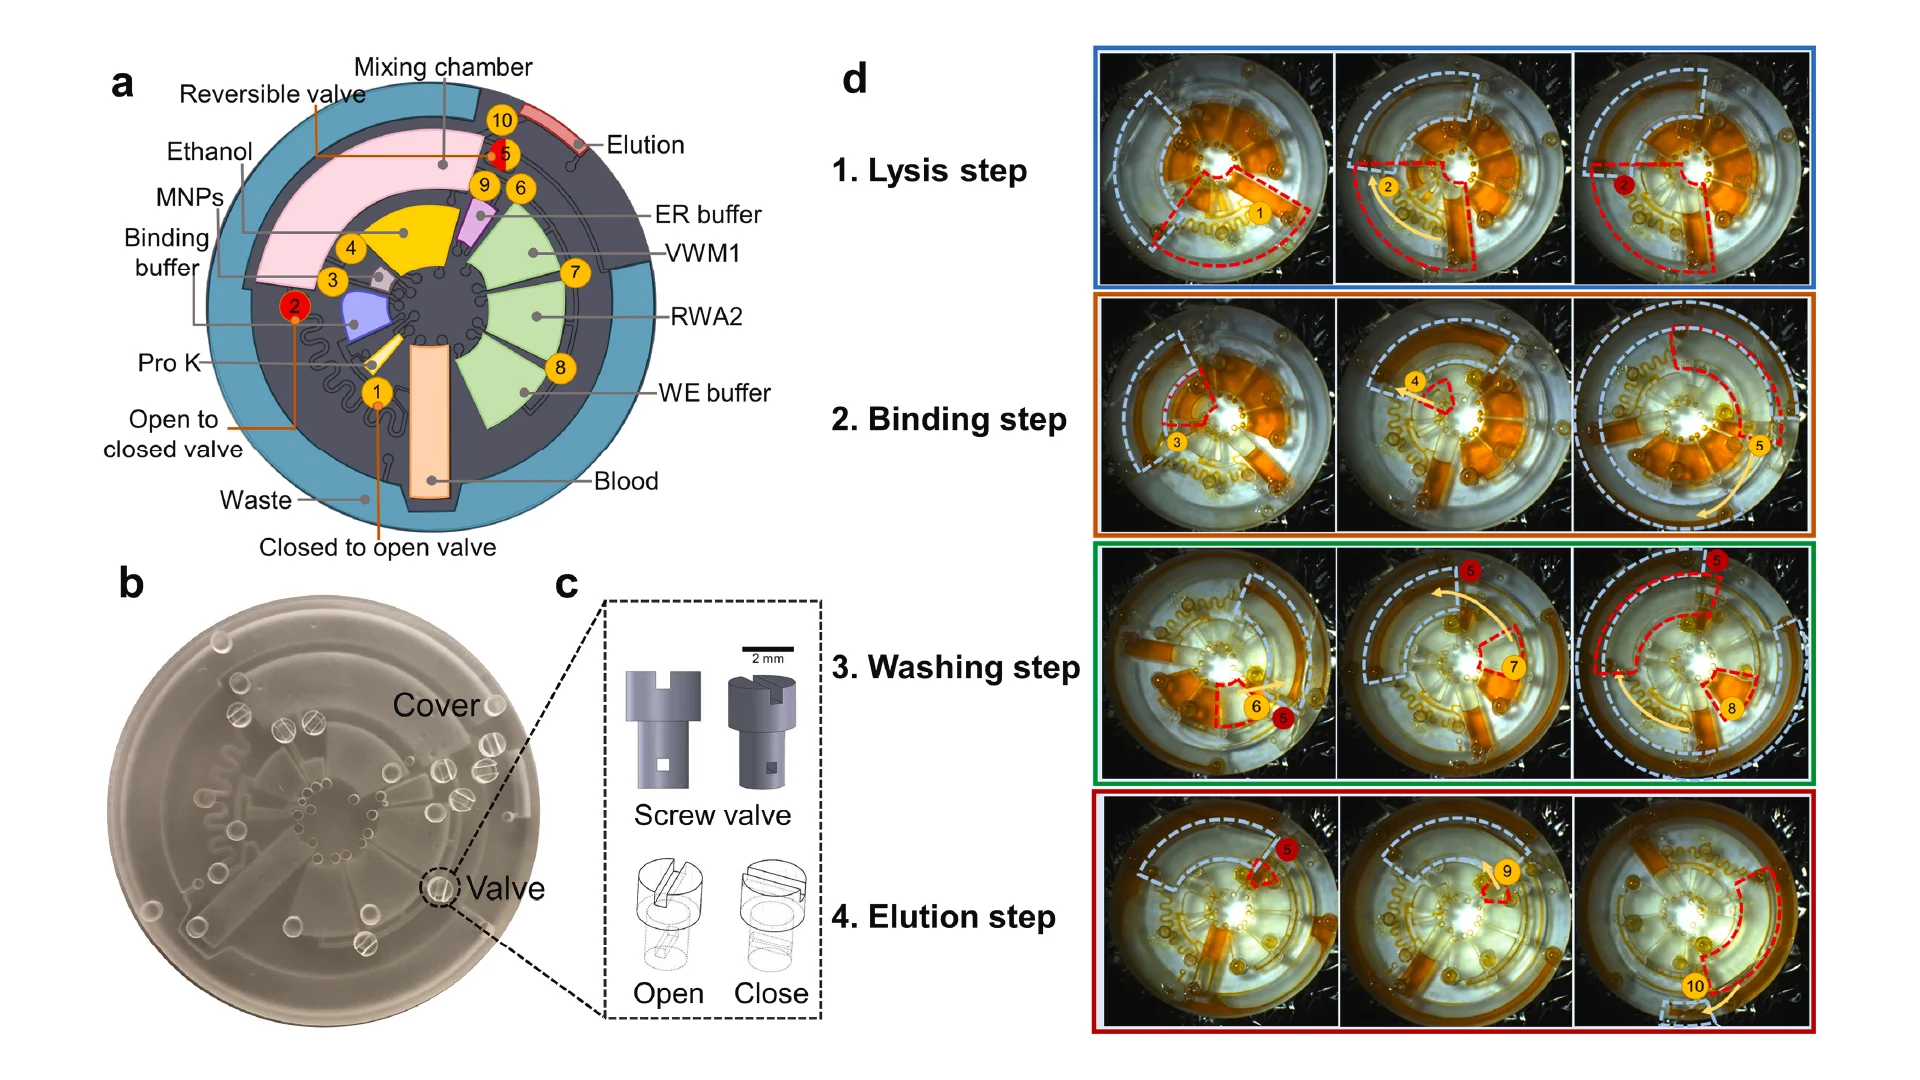
Before employing the R2R manufacturing system to mass-produce the LoaD devices, the 3D printed LoaD was first tested to prove the working concept. The prototype of LoaD was designed and fabricated using a 3D printer with a diameter of 55 mm, a channel depth and width of 500 μm, and all the chamber depths of 2 mm which enabled the device to process human blood volume of 150 μl (Fig. 2a). The LoaD was designed to have twelve liquid storage chambers connected by microchannels with ten 3D-printed screw valves, which consist of a head and a rod with a square hole of the channel size. The head has dimensions of 3 mm in diameter and 2 mm in height, while the rod has dimensions of 2 mm in diameter and 3 mm in height. The valve is opened by aligning the hole with the microchannel. To close the valve and stop fluid flow, it is rotated so that the hole is perpendicular to the microchannel [29]. In addition, a groove parallel to the microfluidic channel on the top head of the valve allows easy operation by using a screwdriver. Finally, the whole device was fabricated by the 3D printing method (Fig. 2b) to test the device’s performance. The structure of the valve and operating mechanism are shown in Fig. 2c. We conducted experiments on different geometries of the plasma separation chamber, such as a simple square chamber, a tilted square chamber [30], and a square chamber with tilted structures [31] to evaluate the separation efficiency (Fig. S3). Since the plasma separation efficiency was almost the same, we decided to choose the simple square chamber for easy fabrication. The mixing performance of our device was enhanced by integrating an S-shaped microchannel as a serpentine micromixer [32] and an optimized mixing chamber [33]. The whole process of RNA isolation from whole blood on this device consists of four steps: lysis step, binding step, washing step, and elution step. In Fig. 2d, we qualified the effectiveness of mixing performance and logical design of the 3D printed LoaD by using food dye color solutions. The solution flow direction is indicated by the red dashed line area to the light blue dashed line area. First, during the lysis step, when valves 1 and 2 were opened then the chip was centrifuged to transfer the solution (orange dye color) in three chambers (blood, proteinase k, and binding buffer chambers as named in Fig. 2a) to the mixing chamber. Second, in the second binding step, valve 2 was closed while valves 3 and 4 were opened sequentially to transfer the solution in the ethanol chamber and MNPs chamber respectively by centrifuging the device. After opening valve 5, the solution in the mixing chamber was transferred to the waste chamber. Third, in the washing step, valves 6,7, and 8 were opened serially to move the solution in VWM1, RWA2, and WE buffer chambers to the mixing chamber respectively, meanwhile, valve 5 was opened and closed alternatively to release the solution in the mixing chamber to the waste chamber. Finally, the elution step was performed by closing valve 5 and opening valve 9 to transfer the solution from the ER buffer chamber to the mixing chamber then valve 10 was opened to move the solution into the elution chamber to complete the sample preparation process. The eluted solution can be used for the diagnosis by extracting it from the elution chamber. Since our design has been proven to have efficient mixing and transferring performance, it can be further fabricated by the R2R additive manufacturing platform. After several flow tests on the 3D printed LoaD, the leakage at screw valves was observed because the micro-gap between the valve and the holding hole is inevitable. To solve this issue, we employed laser-actuated ferro-wax microvalves [34] for our R2R imprinted LoaD. Briefly, the working mechanism of this photonic valve is relied on the phase transition of the ferro-wax, actuated by using only a single laser diode instead of many microfabricated heaters and magnets. The valve can be opened by melting the ferro-wax plug in the channel with laser irradiation for a few seconds, allowing the melting wax to flow into two assistant chambers. The response time for the actuation of these photonic valves was accelerated due to the effective heating of iron oxide nanoparticles embedded in the paraffin wax matrix by the laser beam. The ferro-wax can be solidified rapidly at room temperature when we stop the laser illumination, enabling us to make a plug in the channel again as a closed valve. This simplifies the control of multiple microvalves. We demonstrated the operation of the ferro-wax microvalves in Fig. S4.
3.2. The multi-depth macro-to-micro flexible polymer shim
Due to the dramatic increase in complexity, more microfluidic devices require 3D structures, like multi-depth and layer channels. Moreover, microfluidic chips that combine micron-sized structures with large-volume liquid storage chambers are often required in real-world sample-driven analytical systems for clinical bioanalysis. The conventional way of using photolithography for fabricating these structures is time-consuming and labour-intensive, requiring a precise alignment process and extremely difficult to generate macro-sized features. By utilizing additive manufacturing technology, we developed a rapid and low-cost method for fabricating a multi-depth flexible polymer mold that overcomes the difficulties of traditional molding techniques, especially in integrating macro and micro-sized features. The whole process of fabricating this polymer shim is shown in Fig. 3a. We employed a commercially available resin from the Creative CADwork for the direct 3D printing of master molds that effectively addressed the current issues of time-consuming, nonreplicable, and ineffective surface treatment methods. A commercial flexoplate with low cost, flexible, and uniform thickness was used as the substrate for carrying the patterned molds. This method enabled to rapid manufacture of a large area flexible mold at the lab without using an industrial-scale high-resolution 3D printer. The multi-depth mold, which has a total thickness of 4 mm and consists of 2 mm in chamber depth with a channel depth of 500 μm was well fabricated with the dimension shown in Fig. 3d.
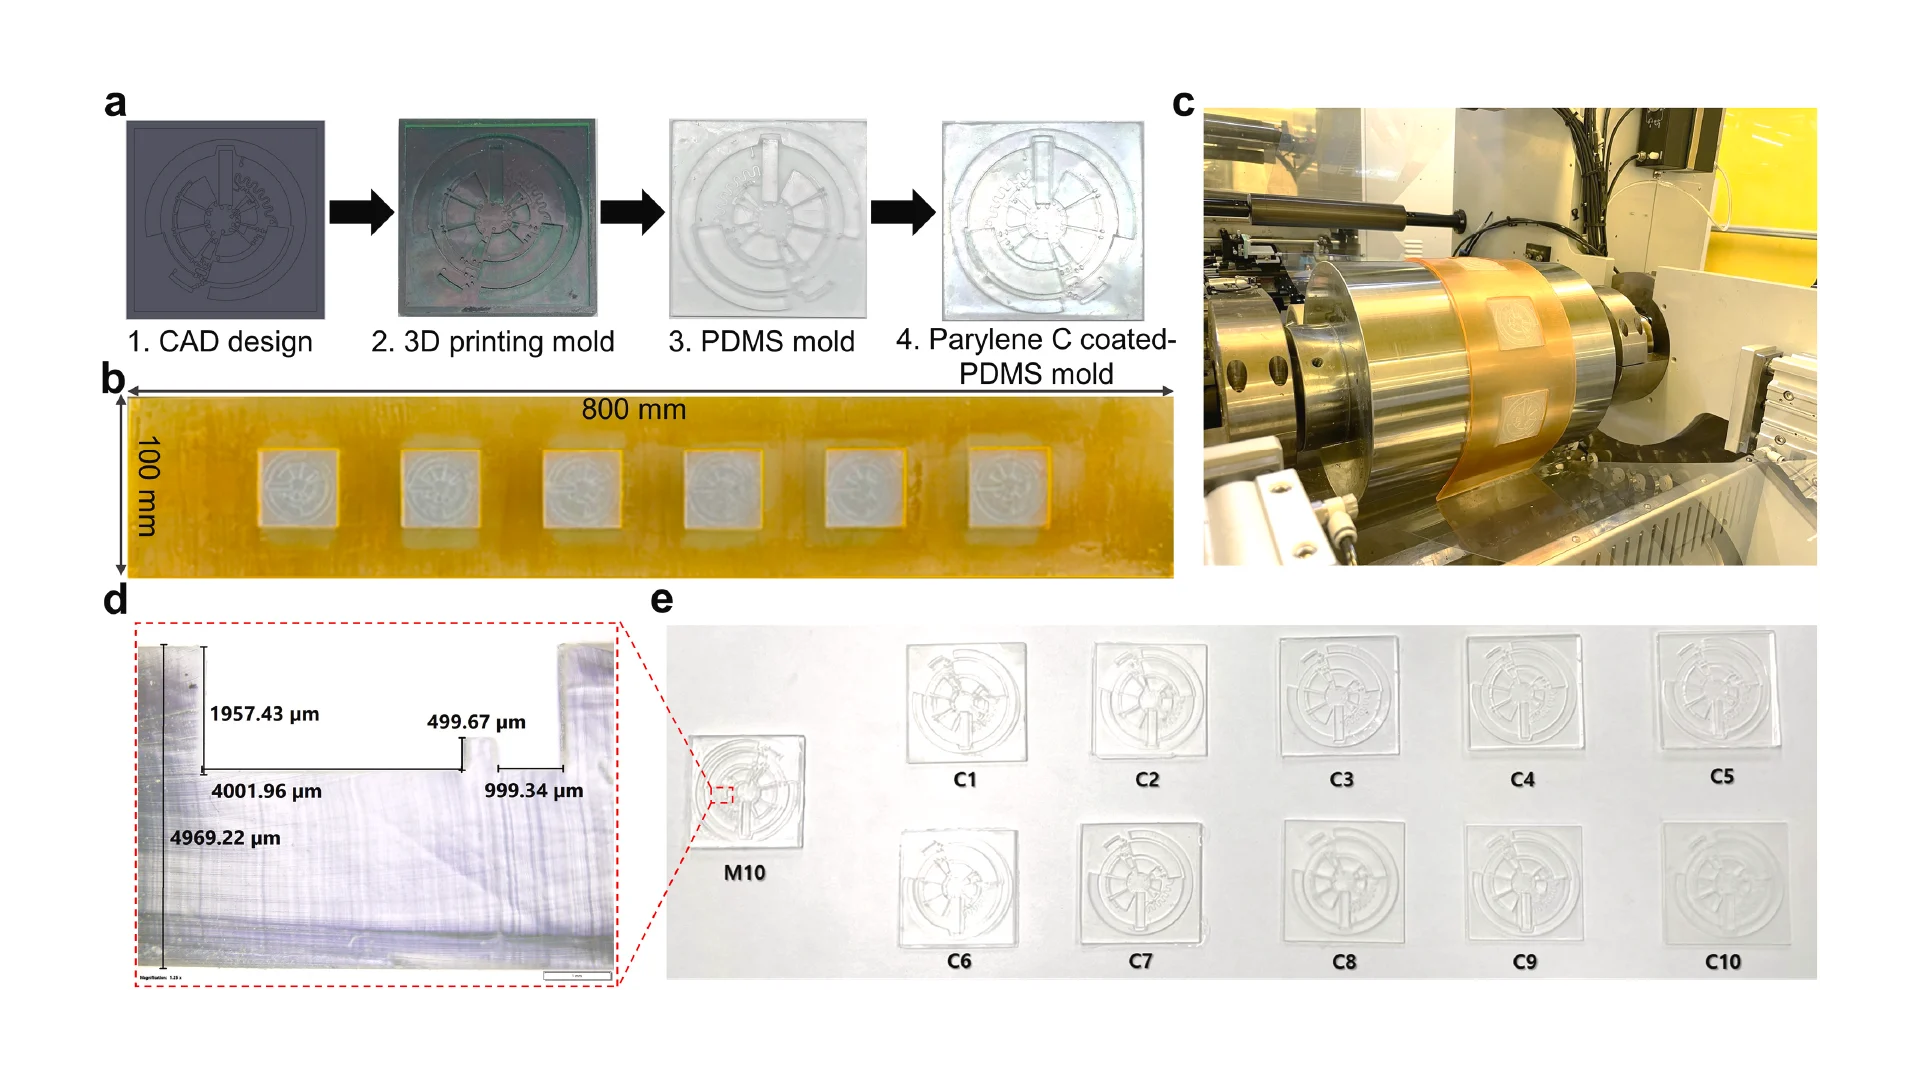
Before starting the R2R imprinting, we applied a conformal coating of parylene C served as surface anti-adhesion (Fig. 1a). This coating material is not only environment-friendly but also extremely effective to prolong the lifetime of the mold without any adhesion to the PDMS resist during the demolding process. To demonstrate that the mold treated with a single coating of parylene C can maintain its anti-adhesive property for a long lifecycle regardless of the number of replica molding cycles, we replicated 10 copies named from C1 to C10 from the master mold named M10. As shown in Fig. 3e, replicas remained high fidelity to the M10 without damaging the master mold. Finally, the flexible properties of this high-thickness polymer mold were demonstrated by wrapping on the imprinting roll with a conformal contact shown in Fig. 3c. This flexible polymer mold was found to be durable because of its capability to withstand high nip pressure (2MPa) for many imprinting cycles.
3.3. The fast-room temperature-curing PDMS
We effectively accelerated the curing time of our PDMS at room temperature by modifying Sylgard 184 formulation with Ashby-Karstedt catalyst and tetrakis (dimethylsoloxy) silane (TDS). As shown in Fig. 4a, the curing time at room temperature of standard Sylgard 184, our PDMS, and vinyl-terminated PDMS are 2 days (2880 min), 10 min, and 12 min, respectively. The addition of 0.1–0.3 wt% Ashby-Karstedt catalyst accelerated the curing time of Sylgard 184 at room temperature and improved its mechanical properties which were demonstrated by Murphy et al. [35]. Additionally, the incorporation of TDS can reduce the curing time significantly [27]. Aiming to reduce the heat waste and energy consumption of conventional R2R hot embossing methods, we optimized the concentration of Pt and TDS into Sylgard 184 formulation to make it possible for the R2R imprinting process at room temperature without using UV and thermal curing systems, which helps to reduce heat waste and energy consumption. In this work, we also modified vinyl-terminated PDMS to cure it rapidly at room temperature as a reference to compare with our PDMS.
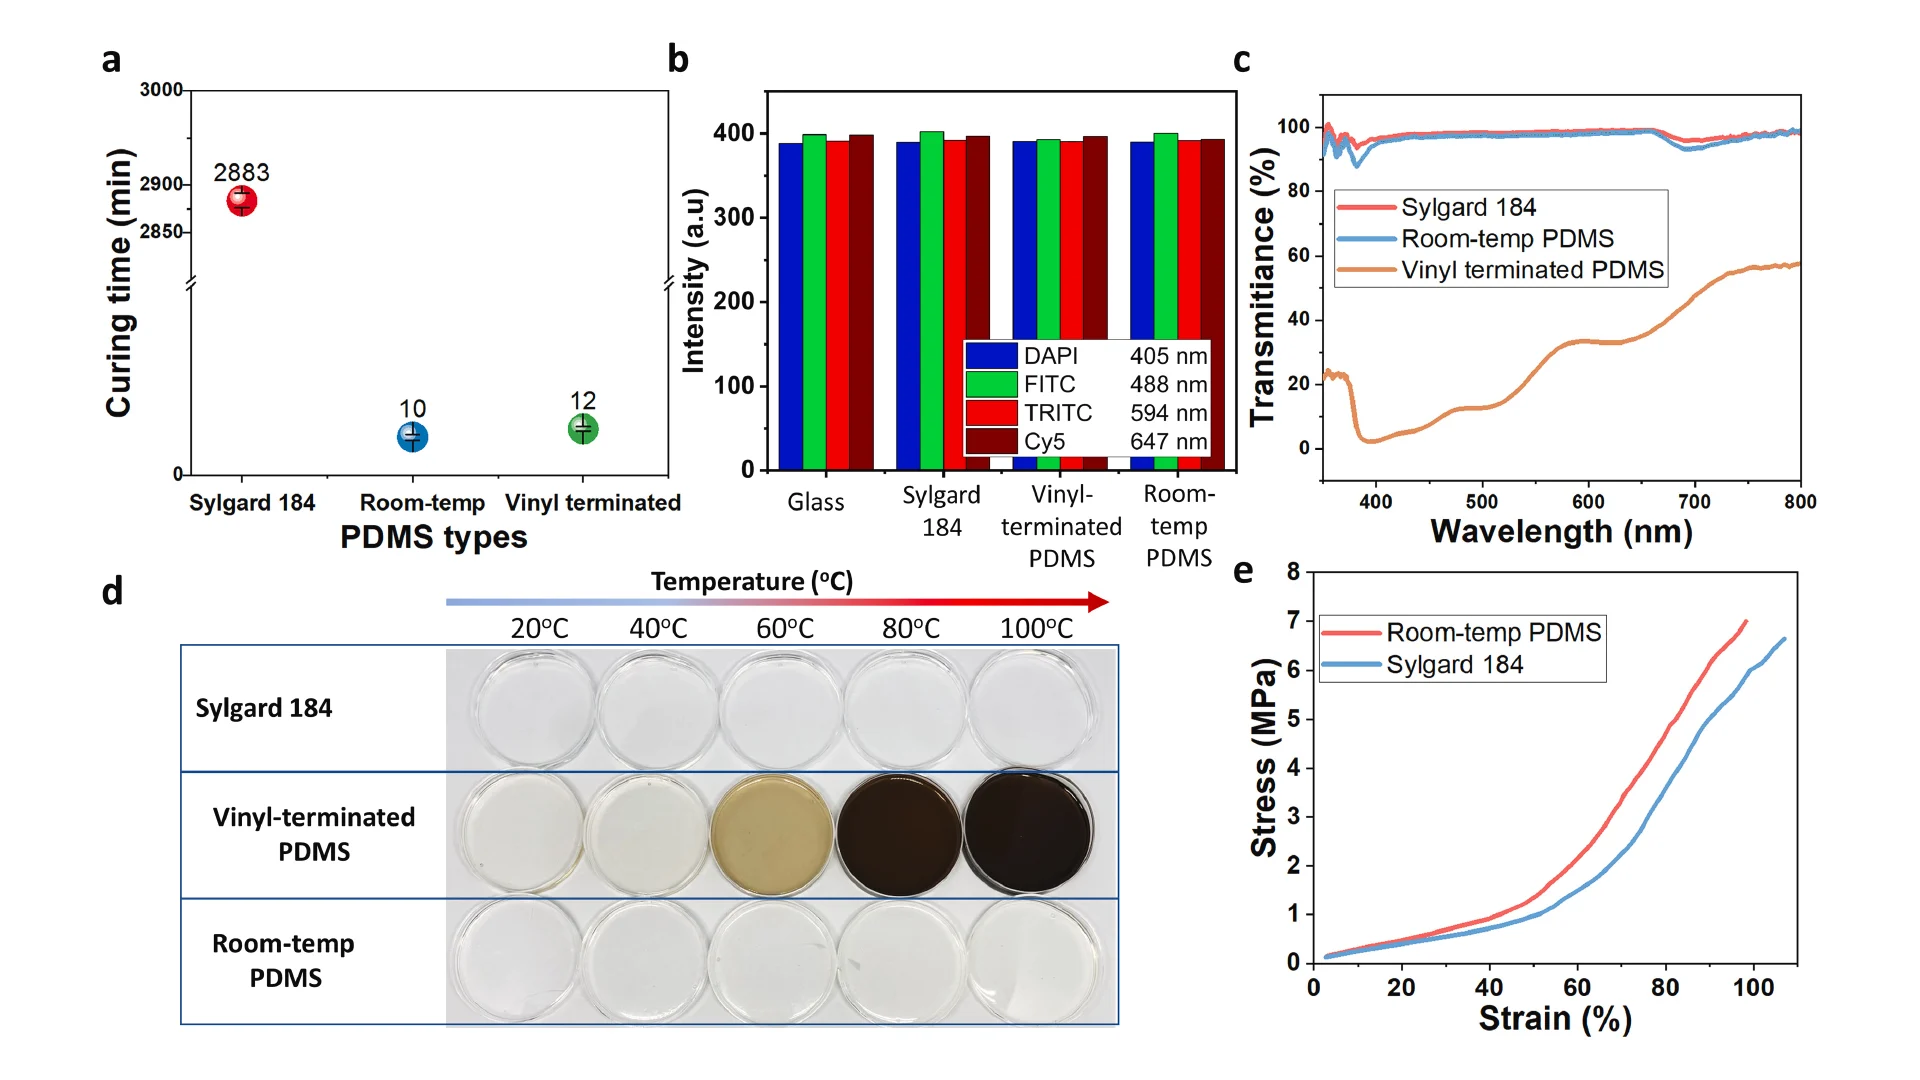
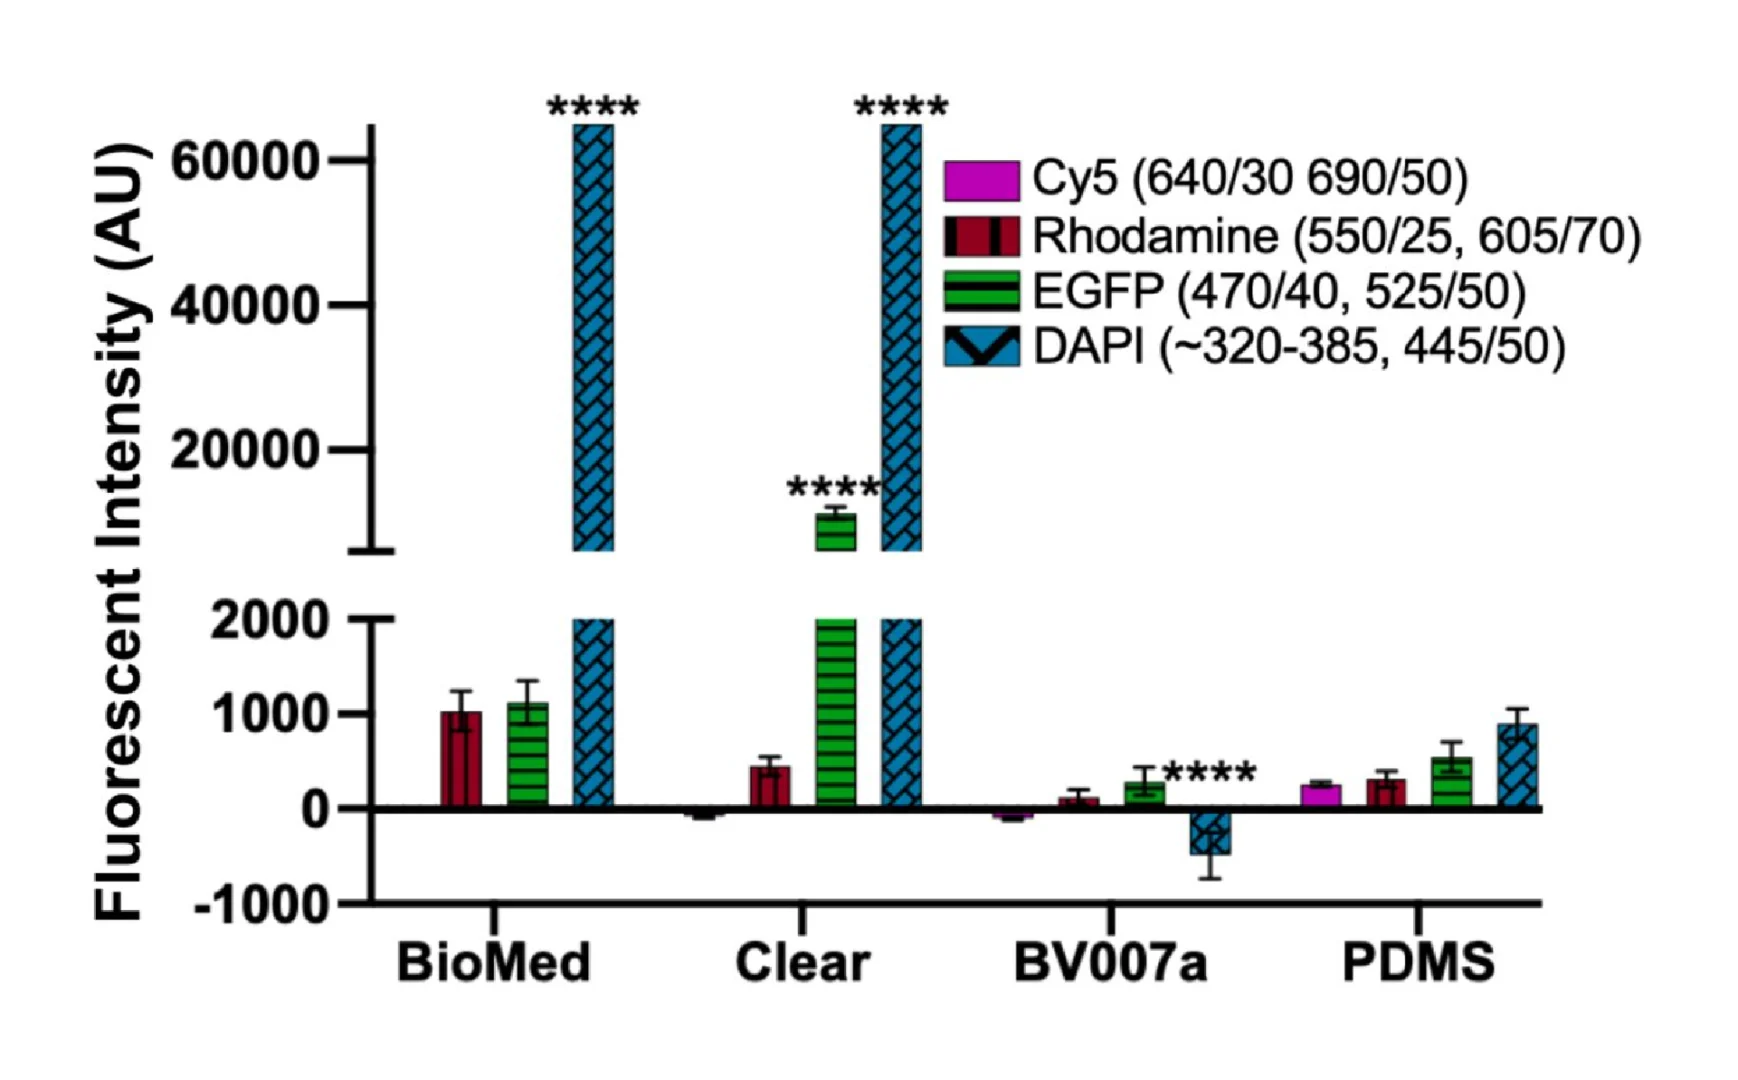
The optical properties of three types of PDMS in this study were measured (Fig. 4b, c, and d). The autofluorescence intensities of three materials and glass substrate were measured by exciting light with four different wavelengths 405 nm, 488 nm, 594 nm, and 647 nm corresponding the excitation wavelength of DAPI, FITC, TRITC and Cy5. In Fig. 4b, the fluorescence intensity of 3 types of PDMS are almost the same in every excitation wavelength, while the glass showed a little decrease in fluorescence intensity. Overall, this confirmed the feasibility of using our room-temperature cured PDMS for biomedical devices at a good quality as the commercial PDMS Sylgard 184 and glass, which were used reference samples. The data about the fluorescence intensity is shown in Table S1. The transmittance of light through the microchannel, also referred to as optical transmittance, is a critical issue for a lab-on-chip (LOC) application since numerous analytical protocols employ visualization equipment operating within the visible wavelength range. For our devices, transmittance plays an important role in the efficiency of the laser-actuated ferro-wax valve. To verify the results, the optical transmittance was measured on all three PDMS samples after the thermal treatment, as shown in Fig. 4c. The transmittance of our room-temperature cured PDMS was lower than that of Sylgard 184 b y an amount of ∼3 %, and both samples exhibited an optical transmittance above 90 % for visible light. On the other hand, the vinyl-terminated PDMS showed poor transparency from 22 % to around 60 % for visible light, which causes difficulty for biomedical applications. This can be explained by the clear-to-yellow discoloration phenomenon of silicones caused by the interaction of platinum-complex [[36], [37], [38], [39]]. We observed the discoloration phenomena on all three types of PDMS by aging them for 1 h in a wide range of temperatures from 20 °C to 100 °C. As illustrated in Fig. 4d, the vinyl-terminated sample produced obvious color changes as temperatures increased. The significant discoloration of this sample can be explained due to the large concentration of platinum-complex by the addition of the Asbhy-Karstedt catalyst and the catalytic reaction of Pt was accelerated as temperature increased. The Sylgard 184 samples remained transparent because no additional platinum was added. Interestingly, even though platinum-complex was added in the formulation of our room-temperature cured PDMS, it remained almost transparent as Sylgard 184 for two reasons. First, the concentration of Pt added was small compared to the vinyl-terminated PDMS to be both cured rapidly at room temperature so that the discoloration level was significantly different between those samples. Second, the addition of TDS prevented discoloration in our PDMS [27].
The mechanical properties of our room-temperature cured PDMS and Sylgard 184 were measured by tensile testing on the dogbone specimens, as shown in Fig. 4e, confirming the quantitatively significant distinction between those two samples. The tensile test results revealed that the room-temp PDMS became harder and less flexible due to the addition of platinum-complex catalyst [35]. The maximum stress and strain of Sylgard 184 are 6.25 ± 0,83 MPa and 101.8 ± 7.02 %, while those of our room-temperature cured PDMS are 5.89 ± 0.98 MPa and 87.51 ± 9.64 %, respectively. We failed to measure the tensile strength of vinyl-terminated PDMS samples due to their extremely low modulus so they were broken during the gripping process before the measurement, as shown in Fig. S6. The water contact angle measurement results shown in Fig. S5 revealed that our room-temp PDMS has the same hydrophobicity property as Sylgard 184 (112.4°) in the meantime the vinyl-terminated PDMS showed a reduction to 105°, which caused adhesion problems during the imprinting process.
3.4. Roll-to-roll replication accuracy
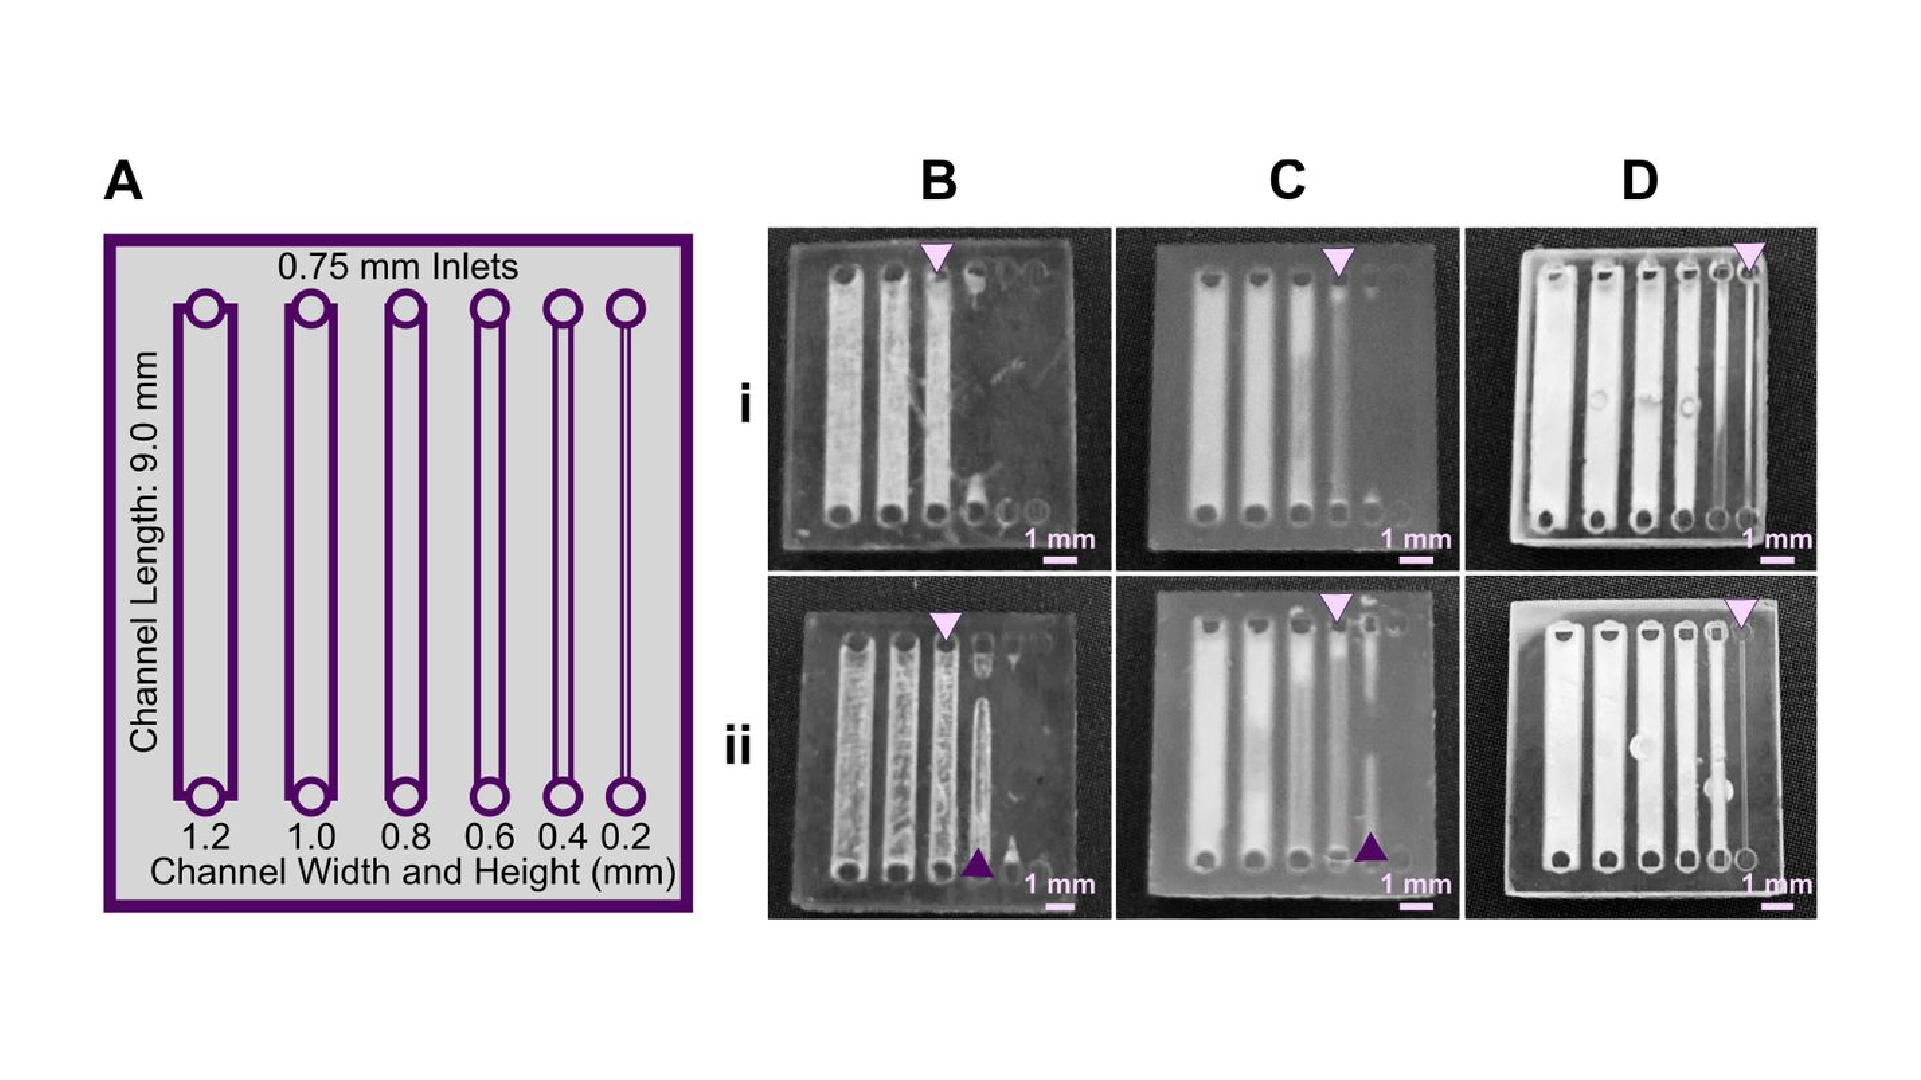
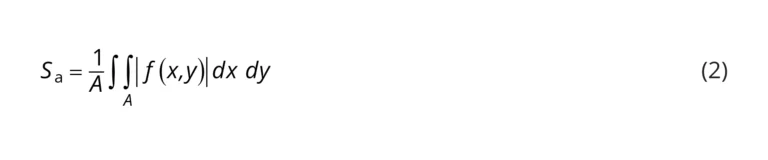
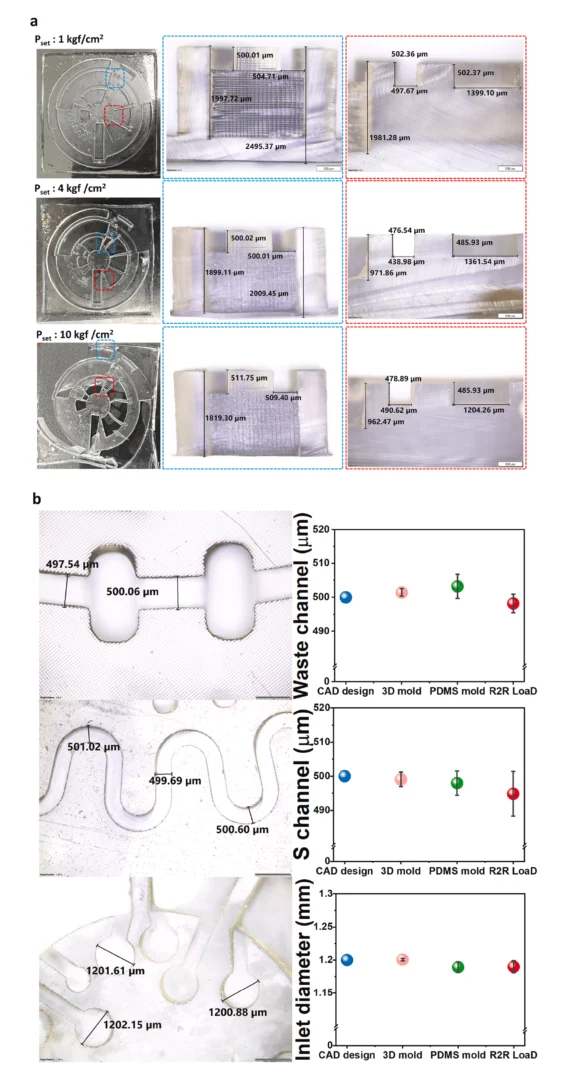
Dimension analysis using the industrial microscope of imprinting tools and PDMS replica (Fig. 5) has shown that the master mold structures were transferred with high accuracy. The results (Fig. 5a) demonstrated that steep sidewalls could be fabricated by our R2R manufacturing platform with only slight bevelling. The cross-section images revealed that the multi-depth of the devices was successfully replicated with an accuracy of 99%. As shown in Fig. 5a, the imprinted chamber depth is 1.99 ± 0.011 mm, and the channel depth is 501.58 ± 1.36 μm while the CAD design were 2.00 mm and 500 μm, respectively. Since parameters such as roll temperature, applied nip pressure, and web transfer speed mainly influenced the quality of imprinted patterns, we optimized those parameters as shown in Table S1. In our developed platform, the operating temperature is low as room temperature, which is not only environmentally friendly but also addresses the common issue in the embossing process resulting from thermal expansion variations between the mold, substrate, and resists. The influence of nip pressure can be seen obviously in Fig. 5a. When the nip pressure increased from 1 kgf/cm2 to 10 kgf/cm2, the deformation of imprinted structures was generated and reduced the thickness of imprinted substrate resulting in failure products. Because the large volume of the devices required a large amount of dispensed PDMS, the imprinting speed was set at 0.3 mm/s to ensure the PDMS filled into the mold patterns with high fidelity and without generating bubbles. Therefore, the curing time of PDMS and printing parameters should be adjusted depending on the structures of the designs so that small devices could be manufactured more efficiently. The best condition for imprinting the LoaD is 1 kgf/cm2 and 0.3 mm/s as nip pressure and imprinting speed, respectively (Table S2). The dimension of three critical positions in the LoaD design (valve, inlet hole of each chamber, and S-shaped channel) of 3D printed mold, PDMS mold, and R2R imprinted LoaD were investigated as shown in Fig. 5b. The lowest variation of structural dimension between final products and computer aid design was in the range of ±2.7 μm, confirming the high replication accuracy of our R2R manufacturing method.
3.5. RNA extraction from whole blood on the R2R additive manufactured LoaD
To evaluate RNA extraction on our device, we implemented a design featuring ten preloaded liquid storage chambers that are separated by photonic valves. The complete protocol for extracting RNA from whole blood can be executed utilizing our LoaD (Fig. S7), comprising plasma separation, sample lysis, magnetic binding, washing, and elution which were designed based on prior literature [31]. The magnetic nanobeads were previously loaded into the mixing compartment and coupled with a small magnet (d = 3 mm) for binding to the intended RNA. All procedures were executed using a centrifuge machine manufactured by Optolane (Fig. S9).
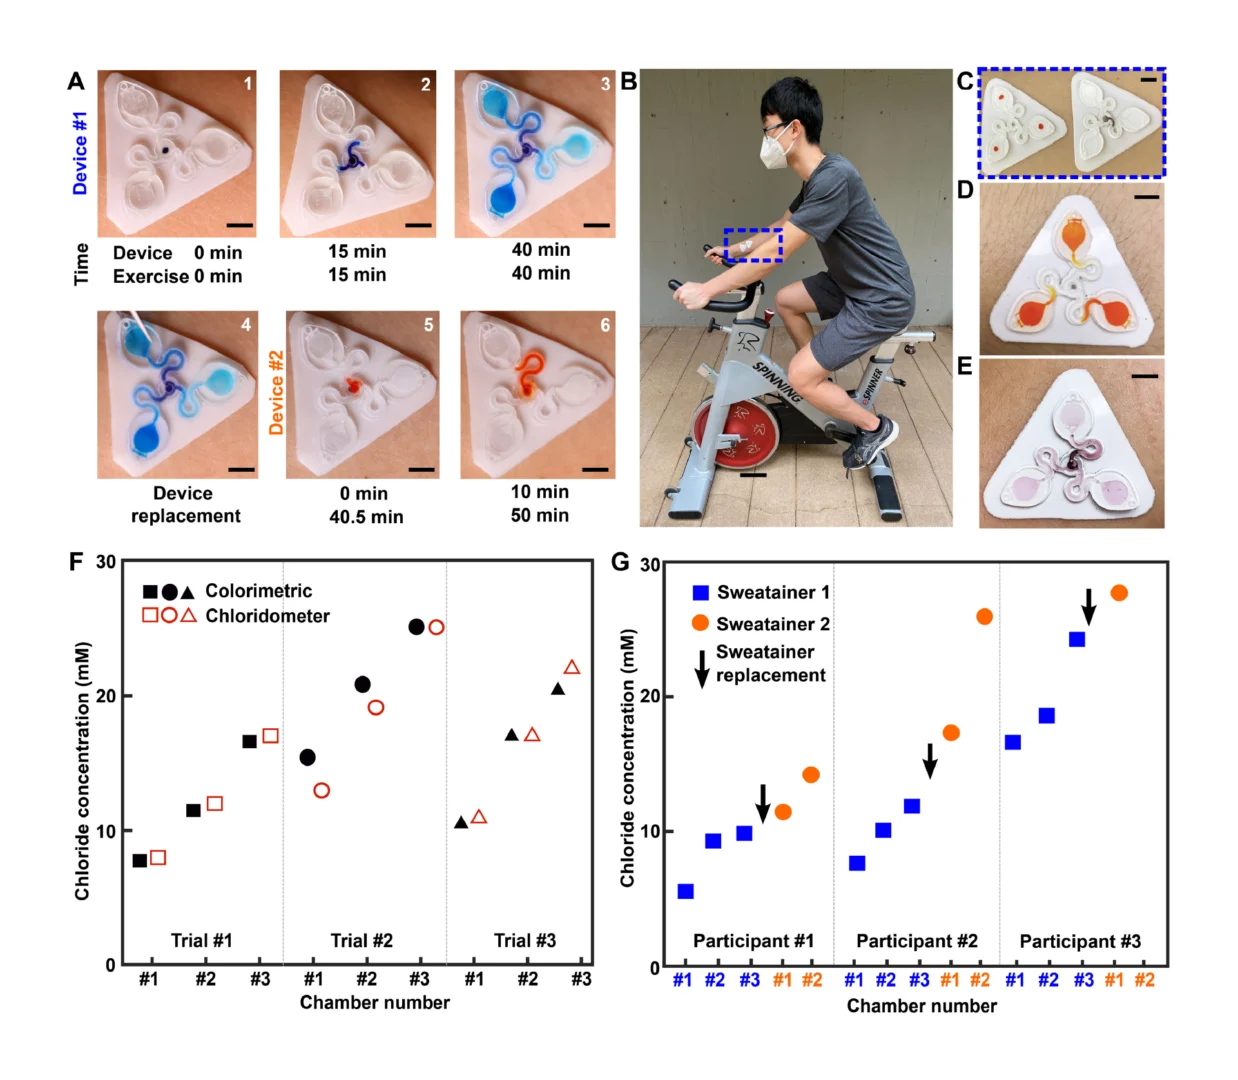
As demonstrated in Fig. 6a, the whole chip process was conducted by using food dye for visualization of leakage testing and real blood samples for RNA extraction which shown in left and right images of each step, correspondingly. A variety of food dyes were pre-loaded onto the LoaD to illustrate each step and validate the functional capabilities of the LoaD in relation to leakage, separation, and mixing criteria (step 1) as following the same process in Fig. 2e. Under the centrifugal force of 2000 rpm per 1 min, no leakage was observed between compartments, and the buffer solutions were efficiently conveyed to the mixing compartment without any backflow to the primary channel. We proceeded with the whole operations (step 1–10) for evaluating all the compartments and obtained similar outcomes. This indicated that the whole functions of our R2R-manufactured devices were successfully tested. As a result, the LoaD was subsequently utilized for testing whole blood for the extraction and validation of RNA. The reagents and procedures are summarized in Table S3. 150 μl of whole blood (step 1) were loaded onto the LoaD and centrifuged at 2000 rpm in 3 min for successfully separating red blood cells (RBCs) and plasma (step 2). The simulation of this separation of plasma from whole blood was reported in our previous work [33]. The blood chamber was optimized on different designs for the easy fabrication and enhancement of the sedimentation rate of RBCs (Fig. S3). Furthermore, the connection channel to the mixing chamber is positioned at a higher elevation in the blood storage chamber to prevent the adhesion of RBCs on the connection channel, allowing the plasma to freely flow into the mixing chamber (step 3). After the plasma separation step, photonic valves 1 and 2 were activated by illuminating them with a laser (808 nm, 500 mW). The iron oxide nanoparticles embedded in the paraffin wax matrix (called ferro-wax) were heated by a laser beam, resulting in the melting of the ferro-wax and moving it from chamber 1 to chambers 2 and 3, thereby opening/closing the connection channel (as shown in Fig. 6b,c and Fig. S4). The chip was then centrifuged at 1000 rpm for 30 s which enabled the transfer of plasma, proteinase K, and VB buffer into the mixing chamber for lysing cell compartments (step 3). Subsequently, photonic valve 3 was opened to allow for the centrifugation-assisted transfer of ethanol to the mixing chamber which precipitated the DNA/RNA released from plasma (step 4) then rotating the devices at a mixing mode for 30 s and incubated at 60 °C for 10 min (step 5). After that, valve 4 was opened to transfer the magnetic nanobeads to the mixing chamber by spinning the chip at 1000 rpm for 15 s (step 6). The DNA/RNA is then attached to the MNPs and magnet in the mixing chamber by mixing and incubating at room temperature for 60 s. The magnet was placed in the mixing chamber from the beginning to reduce the number of steps as shown in Fig. 6d. For further improvement, we can preload magnetic nanobeads in the mixing chamber to avoid issues in improper movement of MNPs to the mixing chamber caused by resistance from PDMS walls. Following the binding process, photonic valve 5 was opened to transfer the aqueous part to the waste chamber. Next, valve 5 should be closed again to prevent waste solution from flowing back into the mixing chamber. Subsequently, photonic valve 6 was opened to release VWM1 and washout any impurities remaining on the mixing chamber and on the DNA/RNA (step 7). After washing, the VWM1 buffer was removed to the waste chamber by reopening valve 5 through centrifugation. This washing process was repeated twice with RWA2, and WE buffer to thoroughly washout all impurities (step 8 and 9). Finally, photonic valve 9 was opened to release ER buffer into the mixing chamber which detached the purified DNA/RNA from the magnet. The eluted DNA/RNA was then transferred to the eluent chamber through valve 10 (step 10). The eluent was then extracted for further analysis by RT-qPCR. The entire purification process of 150 μl blood on the chip could be completed within 30 min.
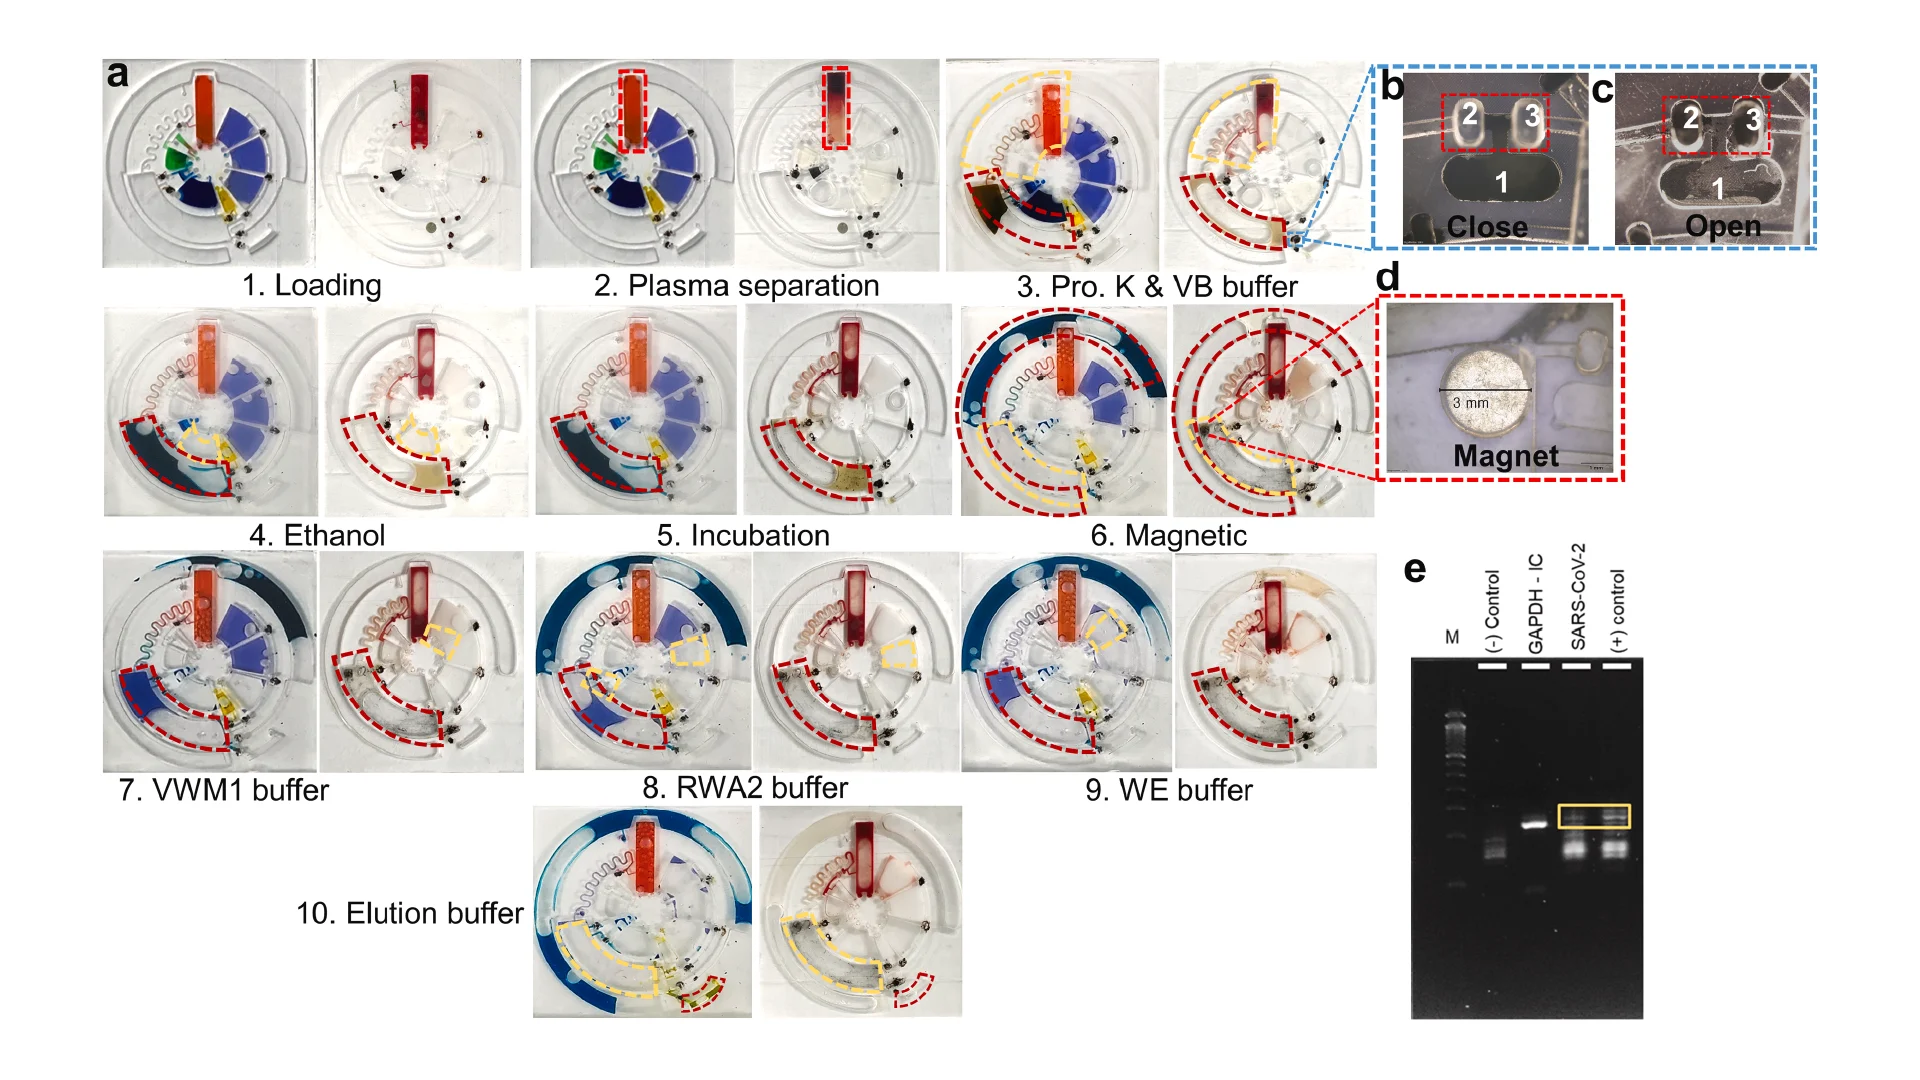
As a demonstration of the feasibility of our method, we performed RT-PCR to further confirm the extraction process by utilizing the LoaD. To validate the on-chip extraction and purification process, we included GAPDH gene primers as an internal control (IC) for house-keeping genes in human. The amplicons were visualized through gel electrophoresis after running a benchtop PCR. In Fig. 6e, lane 1 represents the 50 bp ladder, lane 2 clearly displays a strong band for the GAPDH gene in human, indicating that the plasma was successfully lysed and purified by our device. Next, lane 3 shows the amplification plot of SARS-CoV-2 (103 copies/μl) spiked in whole blood, and lane 4 is the SARS-CoV-2 (103 copies/μl) in whole blood and proceeded with conventional extraction method using same kit as a positive control for comparison with on-chip spiked samples. The intensity of COVID-19 in lane 3 exhibited adequate amplification efficiency compared to the positive sample in lane 4. However, it still demonstrated successful amplification on gel electrophoresis, indicating the extraction and purification of RNA from human whole blood. The weak amplitude may be caused by losing the spiked RNA during the centrifugation of whole blood in the plasma separation chamber. In summary, as a proof-of-concept test, we have successfully employed the R2R additive manufacturing platform to develop a whole blood extraction by utilizing the room-temperature cured PDMS chip and amplified both spiked SARS-CoV-2 and housekeeping gene (GAPDH) using our LoaD.
4. Discussion
The scope of this study was limited in terms of production rate compared to other techniques such as injection molding due to the lab-scale facilities. However, it is certainly possible to scale up this manufacturing process by increasing roll size with optimized mold design as well as reducing the PDMS curing time by adjusting the chemical composition. Firstly, we demonstrated that the production rate could be significantly enhanced approximately ∼7 times compared to the current one by simply optimizing the mold space with the current imprinting roll size (Fig. S10). Therefore, a larger imprinting roll can be employed to enable high throughput industrial-scale manufacturing process. Secondly, the curing time of PDMS is limited by 10 min due to the lack of an efficient dispensing unit that can continuously perform the mixing, degassing, and dispensing the proper amount of uncured PDMS in-line with the imprinting process. By developing this unit, a further study could assess the faster curing time at room temperature. As a result, the cooling condition (−15 °C) can be eliminated by simply adjusting the concentration of catalysts. Furthermore, a PDMS-tape bonding method can be employed for a rapid, simple, inexpensive, and energy efficient laminating method [40] which enable a greater degree of high throughput and sustainability for our proposed manufacturing process.
5. Conclusions
In conclusion, we demonstrated the printing-imprinting integrated R2R continuous in-line additive manufacturing platform, called as green R2R platform, for producing the PDMS-based LoaD with lower energy consumption and less by-products. To realize the green R2R platform, we addressed two main technological hurdles: multi-depth mold fabrication and the fast-room temperature-curing PDMS precursor, enabling a rapid imprinting process. Thus, we developed a rapid, cost-effective fabrication method of a multi-depth flexible polymer shim using 3D-printing technology, which overcomes the challenges in traditional molding techniques especially for integrating macro- and micro-sized features. In addition, we unveiled a novel PDMS formulation by utilizing Ashby–Karstedt catalyst that not only could cure quickly at room temperature, but also could gain better mechanical performance than Sylgard 184 standard. Finally, the resulting PDMS-based LoaD could be expandable for on-site RNA/DNA isolation from the large to a small sample size of whole blood (<150 μl). Our novel fabrication method operated at room temperature which eliminated energy consumption for UV light and heat source will pave the way for addressing the challenges in sustainable high-throughput manufacturing of PDMS-based microfluidic devices which have been highly demanded in the era of Coronavirus (COVID-19) pandemics.
References
- X. Wei, W. Zhou, S.T. Sanjay, J. Zhang, Q. Jin, F. Xu, D.C. Dominguez, X. LiMultiplexed instrument-free bar-chart SpinChip integrated with nanoparticle-mediated magnetic aptasensors for visual quantitative detection of multiple pathogensAnal. Chem., 90 (2018), 10.1021/acs.analchem.8b02055
- M. Dou, S.T. Sanjay, D.C. Dominguez, S. Zhan, X. LiA paper/polymer hybrid CD-like microfluidic SpinChip integrated with DNA-functionalized graphene oxide nanosensors for multiplex qLAMP detectionChem. Commun., 53 (2017), 10.1039/c7cc03246c
- M. Dou, S.T. Sanjay, M. Benhabib, F. Xu, X.J. LiLow-cost bioanalysis on paper-based and its hybrid microfluidic platformsTalanta, 145 (2015), 10.1016/j.talanta.2015.04.068
- H. Tavakoli, W. Zhou, L. Ma, S. Perez, A. Ibarra, F. Xu, S. Zhan, X.J. LiRecent advances in microfluidic platforms for single-cell analysis in cancer biology, diagnosis and therapyTrAC, Trends Anal. Chem., 117 (2019), 10.1016/j.trac.2019.05.010
- F. Hu, J. Li, N. Peng, Z. Li, Z. Zhang, S. Zhao, M. Duan, H. Tian, L. Li, P. ZhangRapid isolation of cfDNA from large-volume whole blood on a centrifugal microfluidic chip based on immiscible phase filtrationAnalyst, 144 (2019), pp. 4162-4174, 10.1039/C9AN00493A
- Z. Noroozi, H. Kido, R. Peytavi, R. Nakajima-Sasaki, A. Jasinskas, M. Micic, P.L. Felgner, M.J. MadouA multiplexed immunoassay system based upon reciprocating centrifugal microfluidicsRev. Sci. Instrum., 82 (2011), 10.1063/1.3597578
- R. Gorkin, J. Park, J. Siegrist, M. Amasia, B.S. Lee, J.M. Park, J. Kim, H. Kim, M. Madou, Y.K. ChoCentrifugal microfluidics for biomedical applicationsLab Chip, 10 (2010), 10.1039/b924109d
- I.J. Michael, T.H. Kim, V. Sunkara, Y.K. ChoChallenges and opportunities of centrifugal microfluidics for extreme point-of-care testingMicromachines, 7 (2016), 10.3390/mi7020032
- T.H. Kim, V. Sunkara, J. Park, C.J. Kim, H.K. Woo, Y.K. ChoA lab-on-a-disc with reversible and thermally stable diaphragm valvesLab Chip, 16 (2016), 10.1039/c6lc00629a
- M.M. Aeinehvand, F. Ibrahim, S.W. Harun, A. Kazemzadeh, H.A. Rothan, R. Yusof, M. MadouReversible thermo-pneumatic valves on centrifugal microfluidic platformsLab Chip, 15 (2015), 10.1039/c5lc00634a
- S.M.A. Mortazavi, P. Tirandazi, M. Normandie, M.S. SaidiEfficient batch-mode mixing and flow patterns in a microfluidic centrifugal platform: a numerical and experimental studyMicrosyst. Technol., 23 (2017), 10.1007/s00542-016-3109-7
- B.L. Thompson, Y. Ouyang, G.R.M. Duarte, E. Carrilho, S.T. Krauss, J.P. LandersInexpensive, rapid prototyping of microfluidic devices using overhead transparencies and a laser print, cut and laminate fabrication methodNat. Protoc., 10 (2015), 10.1038/nprot.2015.051
- S. Hosseini, M.M. Aeinehvand, S.M. Uddin, A. Benzina, H.A. Rothan, R. Yusof, L.H. Koole, M.J. Madou, I. Djordjevic, F. IbrahimMicrosphere integrated microfluidic disk: synergy of two techniques for rapid and ultrasensitive dengue detectionSci. Rep., 5 (2015), 10.1038/srep16485
- E. Duffy, R. Padovani, X. He, R. Gorkin, E. Vereshchagina, J. Ducrée, E. Nesterenko, P.N. Nesterenko, D. Brabazon, B. Paull, M. VázquezNew strategies for stationary phase integration within centrifugal microfluidic platforms for applications in sample preparation and pre-concentrationAnal. Methods, 9 (2017), 10.1039/c7ay00127d
- Y. Xia, G.M. WhitesidesSoft lithographyAnnu. Rev. Mater. Sci., 28 (1998), pp. 153-184, 10.1146/annurev.matsci.28.1.153
- G.M. WhitesidesThe origins and the future of microfluidicsNature, 442 (2006), pp. 368-373, 10.1038/nature05058
- L. Gervais, N. De Rooij, E. DelamarcheMicrofluidic chips for point-of-care immunodiagnosticsAdv. Mater., 23 (2011), 10.1002/adma.201100464
- C.D. Chin, V. Linder, S.K. SiaCommercialization of microfluidic point-of-care diagnostic devicesLab Chip, 12 (2012), 10.1039/c2lc21204h
- J. Hiltunen, C. Liedert, M. Hiltunen, O.H. Huttunen, J. Hiitola-Keinänen, S. Aikio, M. Harjanne, M. Kurkinen, L. Hakalahti, L.P. LeeRoll-to-roll fabrication of integrated PDMS-paper microfluidics for nucleic acid amplificationLab Chip, 18 (2018), 10.1039/c8lc00269j
- E.K. Sackmann, A.L. Fulton, D.J. BeebeThe present and future role of microfluidics in biomedical researchNature, 507 (2014), 10.1038/nature13118
- N. Kooy, K. Mohamed, L.T. Pin, O.S. GuanA review of roll-to-roll nanoimprint lithography | nanoscale research letters | full textNanoscale Res. Lett., 9 (2014)
- S.H. Ahn, L.J. GuoHigh-speed roll-to-roll nanoimprint lithography on flexible plastic substratesAdv. Mater. (2008), p. 20, 10.1002/adma.200702650
- Y. Hirai, S. Yoshida, N. TakagiDefect analysis in thermal nanoimprint lithographyJ. Vac. Sci. Technol. B: Microelectronics and Nanometer Structures, 21 (2003), 10.1116/1.1629289
- H.N. Chan, Y. Chen, Y. Shu, Y. Chen, Q. Tian, H. WuDirect, one-step molding of 3D-printed structures for convenient fabrication of truly 3D PDMS microfluidic chipsMicrofluid. Nanofluidics, 19 (2015), 10.1007/s10404-014-1542-4
- G. Comina, A. Suska, D. FilippiniPDMS lab-on-a-chip fabrication using 3D printed templatesLab Chip, 14 (2014), 10.1039/c3lc50956g
- Y. Chen, W. Pei, R. Tang, S. Chen, H. ChenConformal coating of parylene for surface anti-adhesion in polydimethylsiloxane (PDMS) double casting techniqueSens Actuators A Phys, 189 (2013), 10.1016/j.sna.2012.09.024
- Z. Brounstein, J. Zhao, D. Geller, N. Gupta, A. LabouriauLong-term thermal aging of modified Sylgard 184 formulationsPolymers, 13 (2021), 10.3390/polym13183125
- C. Pina-Hernandez, J.S. Kim, L.J. Guo, P.F. FuHigh-throughput and etch-selective nanoimprinting and stamping based on fast-thermal-curing poly(dimethylsiloxane)sAdv. Mater., 19 (2007), 10.1002/adma.200601905
- M.T. Guler, P. Beyazkilic, C. ElbukenA versatile plug microvalve for microfluidic applicationsSens Actuators A Phys, 265 (2017), pp. 224-230, 10.1016/j.sna.2017.09.001
- T.H. Kim, H. Hwang, R. Gorkin, M. Madou, Y.K. ChoGeometry effects on blood separation rate on a rotating discSensor. Actuator. B Chem., 178 (2013), 10.1016/j.snb.2013.01.011
- C.J. Kim, J. Park, V. Sunkara, T.H. Kim, Y. Lee, K. Lee, M.H. Kim, Y.K. ChoFully automated, on-site isolation of cfDNA from whole blood for cancer therapy monitoringLab Chip, 18 (2018), 10.1039/c8lc00165k
- J. Clark, M. Kaufman, P.S. FodorMixing enhancement in serpentine micromixers with a non-rectangular cross-sectionMicromachines, 9 (2018), 10.3390/mi9030107
- J. Lee, S. Lee, M. Lee, R. Prakash, H. Kim, G. Cho, J. LeeEnhancing mixing performance in a rotating disk mixing chamber: a quantitative investigation of the effect of euler and coriolis forcesMicromachines, 13 (2022), 10.3390/mi13081218
- J.M. Park, Y.K. Cho, B.S. Lee, J.G. Lee, C. KoMultifunctional microvalves control by optical illumination on nanoheaters and its application in centrifugal microfluidic devicesLab Chip, 7 (2007), 10.1039/b616112j
- E.C. Murphy, J.H. Dumont, C.H. Park, G. Kestell, K.S. Lee, A. LabouriauTailoring properties and processing of Sylgard 184: curing time, adhesion, and water affinityJ. Appl. Polym. Sci., 137 (2020), 10.1002/app.48530
- A.K. Antosik, P. Bednarczyk, Z. CzechAging of silicone pressure-sensitive adhesivesPolym. Bull., 75 (2018), 10.1007/s00289-017-2083-2
- K.R. McIntosh, J.N. Cotsell, J. Cumpston, A.W. Norris, N.E. Powell, B.M. KetolaThe Effect of Accelerated Aging Tests on the Optical Properties of Silicone and EVA Encapsulants(2009), 10.4229/24thEUPVSEC2009-4AV.3.54
- E.D. Cifter, M. Ozdemir-Karatas, A. Cinarli, E. Sancakli, A. Balik, G. EvliogluIn vitro study of effects of aging and processing conditions on colour change in maxillofacial silicone elastomersBMC Oral Health, 19 (2019), 10.1186/s12903-019-0798-1
- J.J. Gary, C.T. SmithPigments and their application in maxillofacial elastomers: a literature reviewJ. Prosthet. Dent, 80 (1998), 10.1016/S0022-3913(98)70111-8
- C.S. Thompson, A.R. AbateAdhesive-based bonding technique for PDMS microfluidic devicesLab Chip, 13 (2013), pp. 632-635, 10.1039/C2LC40978J

![Figure 2. Optimized design strategy for fabricating 3D printed epifluidic devices with prescribed channel geometries. (A) Photograph of 3D printed test channels [100 to 900 μm, square; 2-s layer cure time (LCT)]. (B) Plot of variation of printed channel height from designed dimensions as a function of LCT. (C) Plot of variation of printed channel width from designed dimensions as a function of LCT. (D) Plot highlighting the printable region of the digital light processing (DLP) printer used in this work for various channel dimensions relevant to epifluidic devices.](https://cadworks3d.com/wp-content/uploads/2025/07/Academic-Article_UH-Manoa_Skin-interfaced-microfluidic-systems-with-spatially-engineered-3D-fluidics-for-sweat-capture-and-analysis_Figure-2-430x1080.webp)