Ultrasensitive and rapid quantification of rare tumorigenic stem cells in hPSC-derived cardiomyocyte populations
Zongjie Wang 1 2, Mark Gagliardi 3 4, Reza M Mohamadi 5, Sharif U Ahmed 5, Mahmoud Labib 5, Libing Zhang 5, Sandra Popescu 5, Yuxiao Zhou 5, Edward H Sargent 1, Gordon M Keller 3 4 6, Shana O Kelley 2 5 7
The ability to detect rare human pluripotent stem cells (hPSCs) in differentiated populations is critical for safeguarding the clinical translation of cell therapy, as these undifferentiated cells have the capacity to form teratomas in vivo. The detection of hPSCs must be performed using an approach compatible with traceable manufacturing of therapeutic cell products. Here, we report a novel microfluidic approach, stem cell quantitative cytometry (SCQC), for the quantification of rare hPSCs in hPSC-derived cardiomyocyte (CM) populations. This approach enables the ultrasensitive capture, profiling, and enumeration of trace levels of hPSCs labeled with magnetic nanoparticles in a low-cost, manufacturable microfluidic chip. We deploy SCQC to assess the tumorigenic risk of hPSC-derived CM populations in vivo. In addition, we isolate rare hPSCs from the differentiated populations using SCQC and characterize their pluripotency.
We kindly thank the researchers at University of Toronto for this collaboration, and for sharing the results obtained with their system.

Introduction
Human pluripotent stem cells (hPSCs) hold great promise for cell therapy given their ability to differentiate into many different cell types (1). Numerous studies have demonstrated the considerable potential of hPSC derivatives in treating chronic diseases, including neuron degeneration (2) and chronic heart failure (3). Typically, a dose of cell therapy for treating heart failure requires 0.1 to 1 billion of de novo hPSC-derived functional cells (4); therefore, the translation of cell therapy from bench to bedside heavily depends on reliable manufacturing of high-quality cell products (4–6).
The self-renewal and pluripotent properties of hPSCs are also associated with a high level of tumorigenicity in vivo (7). Undifferentiated cells can persist in differentiated populations following long periods of time in culture (8, 9), and rare contaminating hPSCs, even at concentrations less than 0.025%, can lead to teratoma formation in animal models (10–12). As a result, quantitation of the percentage of rare hPSCs is a key quality control parameter that needs to be monitored in manufactured populations to be used for cell therapy applications (4, 13).
Flow cytometry (FCM) and the polymerase chain reaction (PCR) are powerful methods for the analysis of rare cells. Unfortunately, neither of these methods is sensitive enough to rapidly and accurately identify rare hPSCs in relevant samples. FCM has intrinsic limitations including sampling losses and dead volumes (14) that reduce accuracy at exceptionally low levels of hPSC contamination that may still represent a potential risk of tumor formation (15). PCR-based methods are often problematic due to the high background from differentiated cells relative to the rare undifferentiated controls (16) and reverse transcription–induced artifacts, including primer-independent complementary DNA (cDNA) synthesis and template switching (17).
Here, we report a new approach to the quantitation of rare undifferentiated cells: stem cell quantitative cytometry (SCQC). This method takes advantage of a rare cell profiling approach based on a strategy for monitoring cancer cells (18, 19). SCQC uses a microfluidic chip that is scalable, cost-effective, and compatible with the requirements of manufacturing and quality control. SCQC has excellent sensitivity and is able to profile rare hPSCs robustly even when present at concentrations as low as 0.0005% in populations of hPSC-derived cardiomyocytes (CMs). Through the analysis of CM samples containing defined numbers of spiked hPSCs, we demonstrate that SCQC detects rare contaminants with unprecedented performance. Comparative studies show that SCQC can accurately quantify hPSCs at levels that are not reliably detected by either FCM or droplet digital PCR (ddPCR). Last, we use SCQC to isolate live rare hPSCs from differentiated CM populations and characterize their pluripotency.

Results
Development of microfluidic SCQC
The device used for SCQC relies on immunomagnetic labeling to profile cells based on their surface marker expression (Fig. 1A) (20). Cells are labeled with magnetic nanoparticles (MNPs) that bind to a surface marker expressed by hPSCs, but not CMs. Labeled cells are subsequently introduced into a microfluidic device with a flow velocity gradient and a constant magnetic field (Fig. 1, A to C, and fig. S1, A and B). Cells with more MNPs experience a higher magnetic force to compensate the downstream drag force generated by the flow velocity. As a result, the hPSCs that bind more MNPs than the differentiated CMs can withstand high flow velocities and remain in the high-velocity regions of the device. The CMs with few or no MNPs are captured in the low-velocity regions or flushed away. At the completion of the run, the cells trapped in the microfluidic device are quantified by immunofluorescence and microscopy to generate a cytometric profile that includes number, phenotype, and distribution of trapped cells. The information from the cytometric profile provides an assessment of the total number of hPSCs.
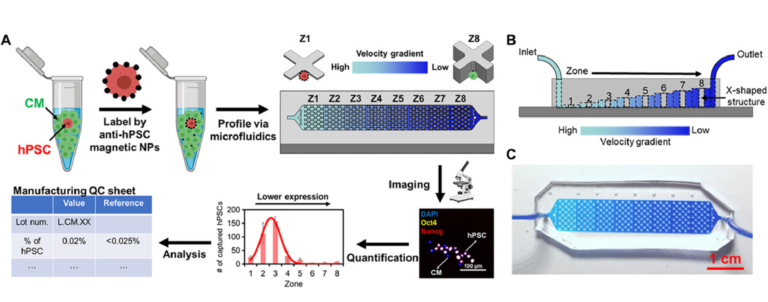
Fig. 1 SCQC for rare stem cell analysis.
(A) Overview of the SCQC approach. Cells are labeled with MNPs functionalized with an antibody against specific stem cell surface markers. Labeled cells are magnetically captured in a 3D-printed microfluidic device with a flow velocity gradient. Stem cells labeled by a high number of MNPs can withstand higher flow velocities and are captured in earlier zones. The number of stem cells in each zone is quantified by immunostaining and microscopy to generate a cytometric profile that can be used for further analysis. (B) Illustration of the microfluidic device for SCQC. Eight sequential capture zones with a decreasing flow velocity gradient are generated by linearly increasing the channel height. (C) Picture of the fabricated device. A dye-containing solution was introduced into the channel to visualize the changes in channel height. Error bar indicates the SD of the mean from three experiments (B).
Sensitivity and specificity of SCQC
We used the HES2 hPSC line and derivative CMs to characterize and optimize the performance of SCQC. The CMs were differentiated for at least 20 days following an established protocol (fig. S2) (21, 22). The hPSC-derived CMs contain more than 85% cardiac troponin T (cTNT)–positive cells. In the first suite of experiments, we used FCM to benchmark eight surface markers (SSEA-1, SSEA-4, TRA-1-60, TRA-1-81, EpCAM, CD90, CD9, and E-cadherin) and three intracellular markers (Oct4, SOX2, and Nanog) for distinguishing hPSCs and hPSC-derived CMs (fig. S3). FCM results revealed that TRA-1-60 and EpCAM offer the highest separation (equivalently the best contrast) among all markers. Hence, we chose TRA-1-60 and EpCAM MNPs for on-chip optimization.
HES2 hPSCs or derivative CMs were labeled with antibody-conjugated MNPs, profiled using SCQC and stained by a (4′,6-diamidino-2-phenylindole) DAPI/NucDead 488 cocktail for visualization (fig. S4A). TRA-1-60 MNPs produced higher levels of hPSC capture and hPSC-derived CM depletion (fig. S4B) than EpCAM MNPs. We also investigated the specificity of the TRA-1-60 MNPs for labeling hPSCs by transmission electron microscopy (fig. S4C). More than 10 major clusters of MNPs were observed on the surface of hPSCs, while 0 or 1 major cluster of MNPs was detected on the CMs. On the basis of these findings, we concluded that the TRA-1-60 has enhanced performance for capturing rare hPSCs in hPSC-derived CMs compared with other surface markers. Next, we tested the direct isolation of hPSCs using TRA-1-60 MNPs via magnetic-activated cell sorting (MACS). However, MACS had poor capture and recovery efficiency for both live and fixed cells (fig. S5). Notably, around 20% of cells, regardless of cell type, remained trapped in the columns and could not be recovered. This is consistent with previous studies (23, 24). Therefore, it is necessary to use the microfluidic chip to enable more efficient recovery and in situ immunostaining of rare cells for quantification.
We next assessed the specificity of SCQC to evaluate its utility for the quantitation of undifferentiated hPSCs. In the absence of an external magnetic field or the absence of MNPs, less than 0.05% hPSCs were captured at the flow rate of 2 ml/hour. Subsequently, the flow rate, which dominates the flow velocity on-chip, was optimized to balance the capture of hPSCs and the depletion of hPSC-derived CMs (fig. S4D). At the optimized flow rate (10 ml/hour), we captured 85.7% of hPSCs while depleting 99.7% of CMs (Fig. 2, A and B). Over 90% of captured hPSCs were detected in zones 1 to 5, which generates a reproducible cytometric profile. In addition, we characterized the dynamic range of the SCQC using the optimized flow rate. The chip had a consistent capture efficiency and cytometric profile in the range of 0 to 5000 hPSCs (Fig. 2C and fig. S4E). The chip offered sufficient depletion (>99%) up to 500,000 CMs (fig. S4E). Also, the chip maintained a consistent capture performance when using other hPSC cell lines, including an induced pluripotent stem cell line (fig. S4F) and other hPSC-derived populations (i.e., definitive endodermal cells) (fig. S4G). On the basis of these results, we conclude that SCQC is a highly sensitive and selective method with an excellent dynamic range for the capture and analysis of hPSCs.
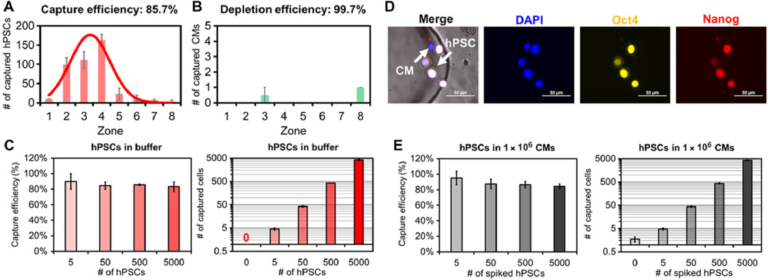
Fig. 2 Characterization of sensitivity and selectivity of the SCQC approach. (A and B) Representative cytometric profiles of captured (A) hPSCs and (B) hPSC-derived CMs at the flow rate of 10 ml/hour (n = 3). (C) Capture performance of hPSCs in CM-free buffer (n = 3). (D) Representative microscope images of captured hPSCs in CMs. HPSCs are quantified as DAPI+, Oct4+, and Nanog+. (E) Capture performance of hPSCs spiked in 1 million hPSC-derived CMs (n = 4). Error bar indicates the SD of the mean from all experiments (A to E). Cell capture experiments (A, C, and E) were performed at the flow rate of 10 ml/hour and the volume of 1 ml. The number of hPSCs (A) or CMs (B) was 500.
We determined the limit of detection (LOD) of SCQC using samples of hPSC-derived CMs spiked with defined numbers of hPSCs. As the SCQC device nonspecifically captures a small fraction of hPSC-derived CMs, immunostaining was used to quantify the number of hPSCs on the fluidic chip. The hPSCs were defined using a cocktail of DAPI, Oct4, and Nanog (Fig. 2D). We found that SCQC can clearly identify the difference between the negative control (zero hPSC in 1,000,000 hPSC-derived CMs) and the 0.0005% sample (five hPSCs in 1,000,000 hPSC-derived CMs as shown in Fig. 2E). Hence SCQC achieves a LOD of 0.0005% for quantifying rare hPSCs.
Quantitative comparison between SCQC, FCM, and ddPCR
We conducted a comparative study to systematically evaluate the performance of SCQC, FCM, and ddPCR for rare hPSC detection. We generated populations of hPSC-derived CMs containing 0.01 to 5% of spiked HES2 hPSCs. For FCM, we used TRA-1-60 and EpCAM as the hPSC markers with a two-laser six-color flow cytometer. For ddPCR, we monitored the expression of three hPSC genes: POU5F1, SOX2, and CD326. TBP or B2M was included as a housekeeping control. For SCQC, we applied the TRA-1-60 MNPs and the flow rate of 10 ml/hour, as detailed above.
The representative profiles obtained by FCM are shown in Fig. 3A and fig. S6A. The hPSC signal (TRA-1-60+ EpCAM+) decreased rapidly with the decreasing number of hPSCs. FCM was unable to detect hPSCs in the 0.1% sample, as the signal for these samples was the same as the signal for the samples that did not contain hPSCs. The combination of the two most sensitive markers (TRA-1-60/EpCAM) yielded the optimal LOD around 0.2% to 0.3% (see fig. S6, A and B). Previous literature suggests that the number of total events that must be collected to detect a population present at a frequency of 0.1% is at least 10 million (25). Routine collection of 10 million events by FCM is neither cost- or time-effective.
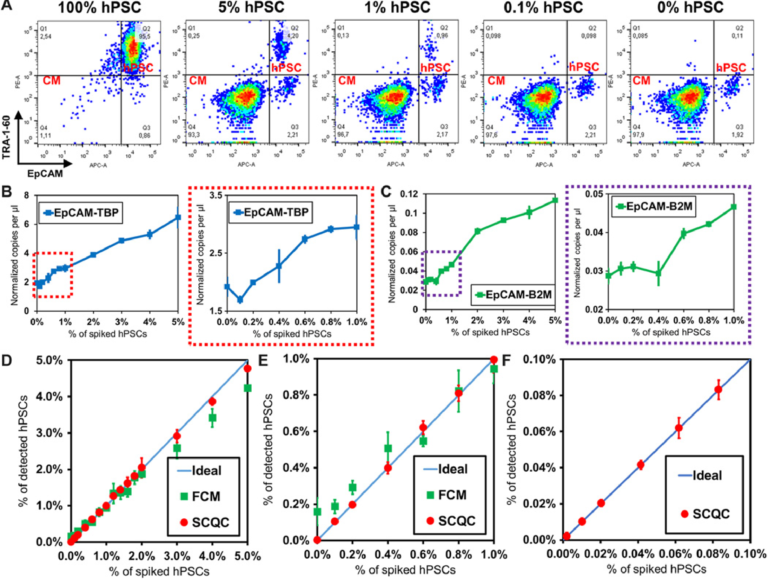
Fig. 3 Benchmarking the performance of SCQC, FCM, and ddPCR for rare hPSC quantification. (A) Representative cytometric profile of FCM for samples with spiked hPSCs. (B and C) Detection performance of ddPCR using EpCAM and (B) TBP or (C) B2M as the housekeeping control for normalization. (D to F) Detection performance of SCQC and FCM in the range of (D) 0 to 5%, (E) 0 to 2%, and (F) 0 to 0.1% (n = 3 for SCQC, FCM, and ddPCR; 50,000 cells were analyzed for each replicate). Error bar indicates the SD of the mean from three experiments (B to F). Cell capture experiments (D to F) were performed at the flow rate of 10 ml/hour using a total volume of 1 ml. Each cell suspension contained 50,000 hPSC-derived CMs spiked with various amounts of undifferentiated hPSCs in the desired final concentration, as indicated on the x axis.
The representative ddPCR results are shown in Fig. 3, (B and C) and fig. S6 (C and D). From the three primer sets tested (POU5F1, SOX2, and EpCAM), we found that the combination of EpCAM as the target and TBP as a housekeeping gene yielded the lowest LOD, calculated at 0.2 to 0.4% (Fig. 3B). The LOD obtained using POU5F1 and SOX2, which are the definitive genes for pluripotency, was higher than 1% (fig. S6D). This is not an unexpected result as previous literature has indicated that pluripotent genes (i.e., POU5F1, SOX2, Nanog, Klf-4, and Lin28) are weakly expressed at the RNA level in hPSC-derived cells, typically in the range of 0.01 to 1% relative to undifferentiated hPSCs (16, 26). As a result, the signal from rare hPSCs is concealed by the large background generated by a substantial excess of hPSC-derived cells. Therefore, given the lack of a specific hPSC marker, ddPCR is not a practical method for quantifying rare hPSCs in differentiated population.
We summarized the comparative results in Fig. 3 (D to F). The LOD of SCQC, FCM, and ddPCR is <0.01, 0.2 to 0.3, and 0.2 to 0.4%, respectively (table S1A). In addition to having a superior LOD, SCQC also offered the best linearity of detection (R2 > 0.99) among the three technologies (table S1B). On the basis of this comparative study, it is clear that SCQC outperforms the existing cell detection methods when quantifying rare hPSCs in batches of differentiated CMs. In addition, SCQC also has other advantages for cell manufacturing including cost-effectiveness, scalability, and compatibility with the U.S. Food and Drug Administration Current Good Manufacturing Practice (cGMP) regulations (27) (table S2). SCQC facilitates accurate detection and quantitation of undifferentiated cells within an hour at a cost of $30 per chip per run. Given its compact design and scaled fabrication method, this technology can be easily set up to support parallelized and large-scale operations.
Analysis of the tumorigenicity of rare hPSCs
To benchmark whether the performance of SCQC is relevant for the analysis of batches of therapeutic cells, we used SCQC to assess the tumorigenicity of samples containing different levels of hPSCs (Fig. 4). We prepared samples of hPSC-derived CMs (1 million) spiked with different numbers of hPSCs to yield contamination frequencies of 0.03 and 0.3%. CM populations with no additional hPSCs (0%) were used as controls. The three samples were injected into the testis of male NOD/SCID/Gamma (NSG) mice (Fig. 4A) to measure teratoma potential. A small portion (50,000 cells) of each sample was used for hPSC detection by SCQC and FCM analyses (Fig. 4B). As shown in Fig. 3B, SCQC was the only technology that correctly identified the percentage of hPSCs in differentiated CMs before injection. FCM analysis failed to distinguish the differences among three samples [P > 0.05 when performing the analysis of variance (ANOVA) between any of two samples].
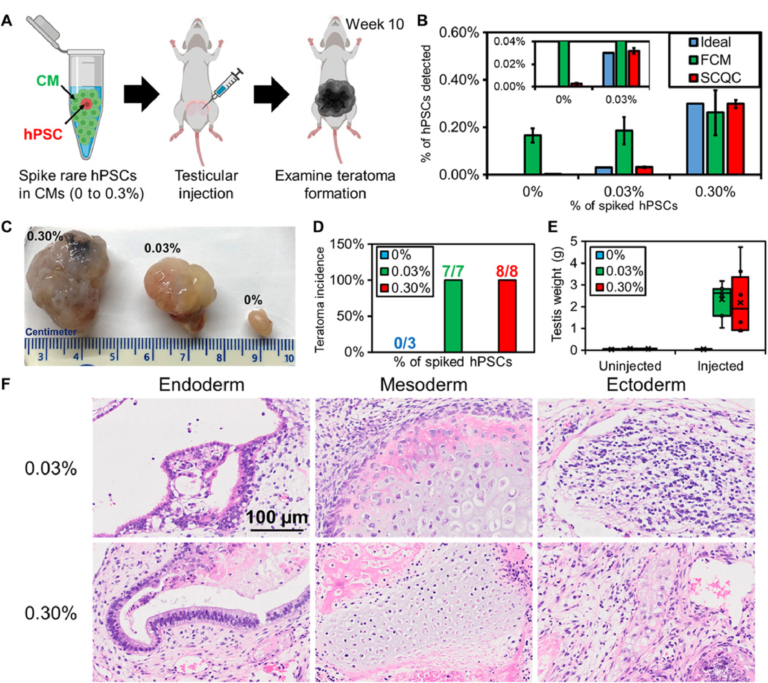
Fig. 4 Rare hPSCs form teratomas in vivo. (A) Workflow of the teratoma-forming assay. Exogenous rare hPSCs were spiked into hPSC-derived CMs to form cell mixtures for testicular injection. After 10 weeks, the mice were euthanized to examine teratoma formation. (B) Quantification of hPSC concentration in the samples used for injection (n = 3 for SCQC and n = 5 for FCM). (C) Representative pictures of fixed teratoma from 0% hPSCs, 0.03% hPSCs, and 0.3% hPSCs and to hPSC-derived CMs. (D) Percentage of teratoma formation in mouse models. (E) Weight of teratoma in mouse models. (F) The 0.03% and 0.30% hPSCs added to hPSC-derived CMs can form a mature teratoma that contains three germ layers, as visualized by histology. Error bar indicates the SD of the mean from all experiments (B). Whisker, box, cross, and horizontal line indicate the minimum/maximum, first/third quartile, mean, and median from each group, respectively (E). Dots represent data points (E). Cell capture experiments (B) were performed at the flow rate of 10 ml/hour using a total volume of 1 ml. Each cell suspension contained 50,000 hPSC-derived CMs spiked with various amounts of undifferentiated hPSCs in the desired final concentration, as indicated on the legend.
All the mice in both experimental groups developed teratomas after 10 weeks (Fig. 4, C and D). The averaged testis weight in the 0.03 and 0.3% hPSC group underwent a marked increase from 0.1 g to over 2 g (Fig. 4E). Conversely, mice in the control (0%) group were teratoma free, and no significant change in testis was found. This result matched with the previous studies that showed that populations consisting of 0.025% hPSCs diluted in feeder fibroblasts could initiate teratoma formation within 12 weeks (28).
We further characterized the teratomas by histopathology (Fig. 4F) and detected multiple cell types including pancreatic, respiratory, and intestinal epithelium (endoderm); cartilage, bone, fibrous, and adipose connective tissue (mesoderm); and melanocytes and glial cells (ectoderm). The histopathological finding indicates that the hPSCs retain strong pluripotency and are capable of developing mature tumors in vivo. Together, these findings demonstrate that quantification of rare hPSCs with an LOD of 0.03% or lower is required to avoid the formation of teratoma in animal models. However, the minimal number of hPSCs that is sufficient to form teratoma remains unclear and will depend on several variables including the hPSC cell line, the number of injected cells, the format of injected hPSCs (clumps or single cell), and the site of injection (29, 30). While determining this number was beyond the scope of this study, we envision being able to take advantage of the sensitivity of SCQC to determine the number of hPSCs required to form teratoma under a clinically relevant dosage.
Isolation and characterization of live rare hPSCs
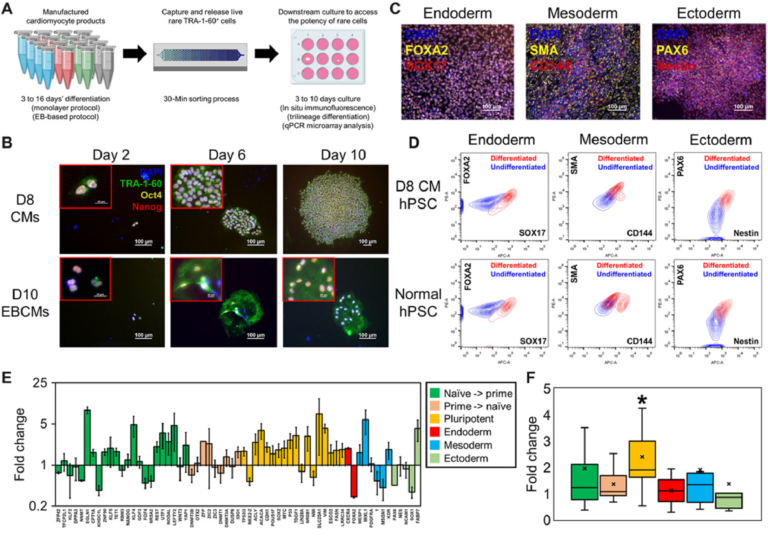
Isolating live rare hPSCs in hPSC-derived CMs may provide insights into the origins of heterogeneity for in vitro differentiation processes. We next applied SCQC to the isolation and characterization of live rare hPSCs in CM populations. For these studies, we generated CM populations from HES2 and HES3-NKX-2.5GFP hPSCs using both monolayer- and embryoid body (EB)–based protocols and profiled the samples using SCQC. After capture, the external magnetic field was removed, and the cells in the chips were isolated and expanded in culture (Fig. 5A).