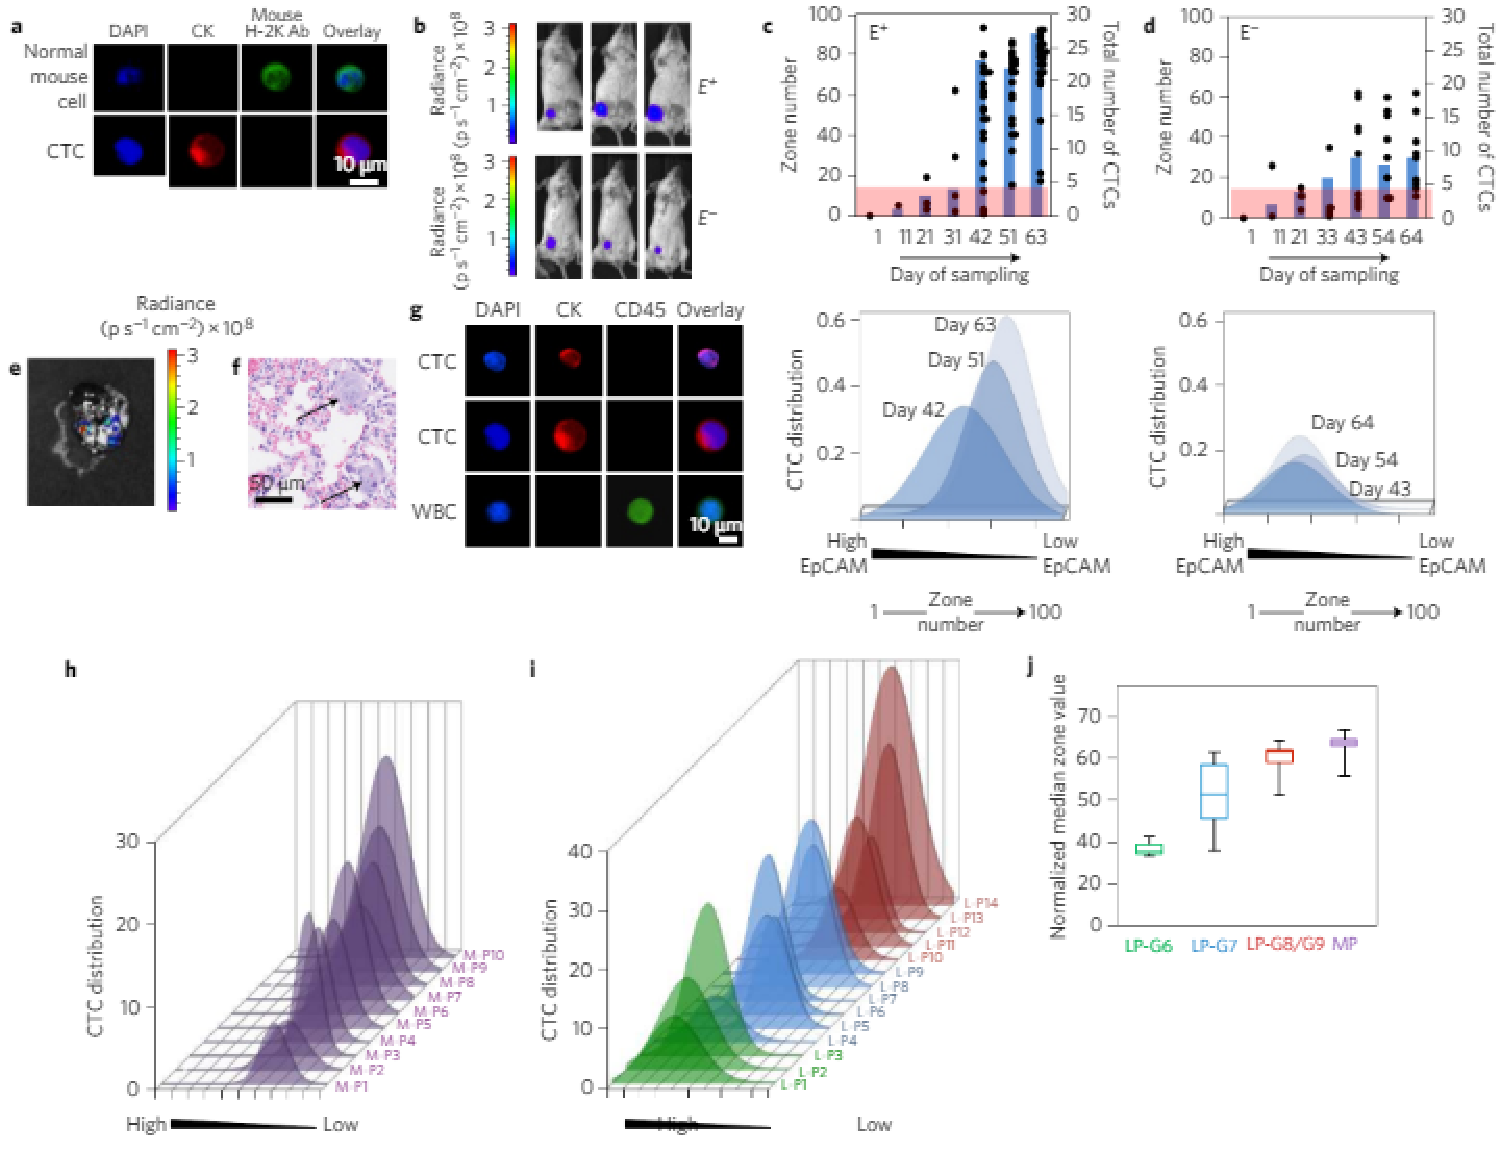
3D printing on glass for direct sensor integration
Lin Ding, Sajad Razavi Bazaz, Mahsa Asadniaye Fardjahromi, Flyn McKinnirey, Brian Saputro, Balarka Banerjee, Graham Vesey & Majid Ebrahimi Warkiani
Significant improvements are being made in 3D printed microfluidics. 3D printing of microfluidic prototypes gained importance due to the fabrication flexibility compared to conventional techniques. Applications using these devices often require optical access to internal channels but even clear resins create translucent channels due to surface roughness and imperfections. This paper describes a 3D printing approach to form fluidic channels directly onto glass substrates that allows optical access to fluidic channels without distortion from 3D printing material. The glass substrate is itself a part of the flow channel which guarantees optical transparency. Micro- fabricated conductivity and impedance spectroscopy sensors were fabricated on glass substrates and placed in a custom made 3D printer build plate before fluidic structures are directly printed on top of the sensors. The effects on sensor performance and properties were evaluated using co-linear four-point probe resistance measurements, Raman spectroscopy, and impedance spectroscopy. It was shown that no resin or other chemicals are left behind from the printing procedure and sensor performance was unaffected. A proof of concept impedance-conductivity sensor was integrated with a 3D printed flow channel and shown to work as both conductivity and bacterial cells detection sensor.
We kindly thank the researchers at Montana State University for this collaboration, and for sharing the results obtained with their system.

Introduction
Additive manufacturing (AM) is becoming an increasingly viable option for the creation of fluidic devices [1–6]. Vat polymerization printing (VPP) such as stereolithography (SLA) and digital light processing (DLP) are popular techniques for creating 3D printing microfluidics due to their high resolution [7, 8]. The resolution of various printing techniques such as VPP, material extrusion, and material jetting are compared in [1–3,5,7]. 3D printing allows one-step creation of fluidic devices with high throughput and straightforward device parameter adjustment in Computer-Aided Design (CAD) software. Designs and devices can be distributed and replicated in different facilities by merely sharing the design files [1]. Commercial availability of printers and resins capable of truly microfluidic (sub 100 μm features) devices is somewhat limited [9]. In this paper, we demonstrate the integration of micro-fabricated sensors on glass with a high-resolution 3D printing technique.
Optically transparent surfaces within microfluidic devices are essential for accurate quantification of chemical, biological, and mechanical interactions [10]. Many 3D printing resins, however, are not clear, and while the use of clear resins theoretically allow for the creation of transparent devices, inherent surface imperfections can cause light diffusion creating translucent channels. There are several examples in the literature of devices printed on glass to create a very smooth surface using SLA and DLP techniques. Urrios et al utilized a glass build plate and glass vat to decrease surface roughness and increase print transparency in bio-microfluidic devices [11]. Gong et al constructed a custom printer to create microfluidic devices on glass substrates in order to avoid using an anodized aluminum build plate and to provide optical access to internal microfluidic components [12–14]. Parker et al 3D printed microfluidic devices with immunoaffinity monoliths on glass allowing for fluorescence measurements for the extraction of preterm birth biomarkers [15]. Lee et al 3D printed Quake style valves using glass as a build plate to increase channel visibility, eliminating the need to remove the device from the build plate, and to provide a flat, stable surface for a microscope stage [16]. Kim et al printed multiple designed microchannels on glass for convenient optical access [17, 18]. Beauchamp et al characterized the 3D printing of sub-100 μm external and internal, positive and negative resolution features and additionally created a particle trapping device with the particles clearly seen as viewed through glass [19]. Beauchamp et al again printed on glass to create visible microfluidic channels and fluorescent emission of preterm birth biomarkers inside the channel was collected [20]. Rogers et al fabricated 3D printed microfluidic channels with valves, and claimed that their ability to print directly on glass opened the possibility for direct integration of printing on materials with patterned electrodes [21]. The previous examples of printing on glass utilized base layers to ensure proper attachment, limiting the possibility of direct interaction between sensor material and fluids. Rather than printing directly on glass, Plevniak et al used an SLA printer to print a 50 μm open channel and then covalently bonded to glass post- printing resulting in a closed hollow channel [22]. Notably, Kou et al printed microfluidic channels directly on glass without the use of base layers to create an optical window for phase-contrast microscopy and fluorescence microscopy. [23]. However, a direct sensor integration in the 3D printed fluidic channel was not shown.
Integrating sensors for 3D printed fluidics is reviewed by Li et al [24]. Banna et al embedded pH and conductivity sensors into a fused deposition modeling (FDM) 3D print post-print allowing for sensor removal and replacement [25]. Using a print- pause-print technique, Gaal et al demonstrated a process for directly integrating an FDM printed structure with an electronic sensor by printing directly on the sensor rather than inserting the sensor post-print. Gold interdigitated electrodes (IDEs) were evaporated on a transparency sheet and a polydimethylsiloxane (PLA) channel was printed directly onto the transparency sheet creating an integrated electronic tongue sensor with optical window for increased channel visibility [26]. Pol et al described a fully integrated screen-printed sulfide-selective sensor on a 3D printing potentiometric microfluidic platform accomplished by a screen-printing step between two main FDM printing stages [27]. Di Nova et al designed, fabricated and tested a fully aerosol jet printed (AJP) electrochemical microfluidic sensor. Dispensed and cured silver- silver chloride and carbon ink formed electrochemical sensing elements on an alumina substrate while UV-curable polymer ink created a flow channel surrounding the sensing elements [28]. While these techniques work well for sensor integration, none utilize a glass substrate for optically clear channels.
Glass substrates are a viable method for creating optically transparent channels using high resolution printing techniques such as VPP or material jetting described above, however sensor integration often requires a multi-step integration process. In this paper, a glass based impedance-conductivity sensor is directly integrated with a 3D printed flow channel as a proof of concept device. This device is shown to work as both a conductivity sensor and bacterial cells detector. This is accomplished by printing directly on a glass substrate with patterned electrodes without the use of base layers using a DLP resin printer. Build plate modification and glass silane treatment facilitated this direct integration. The motivation for optical access in flow channels is well documented above and further explored below. Resin-printer deficiencies were overcome and sensor performance and properties were quantified both before and after device printing. Finally, sensor functionality is demonstrated with various conductivity and bacterial cells solutions. This work is significant because the advancement and advantages of 3D printed microfluidics described above can be directly integrated with sensors to study biological processes.
2. Methods
2.1. Printer integration
A MiiCraft 50 was the 3D printer utilized in this work. This printer uses 405 nm light to selectively cure polymer to form 3D structures by area-projecting light using DLP as described in [7]. Clear BV007 resin (MiiCraft) was chosen for its advertised low viscosity, transparency, and printer compatibility
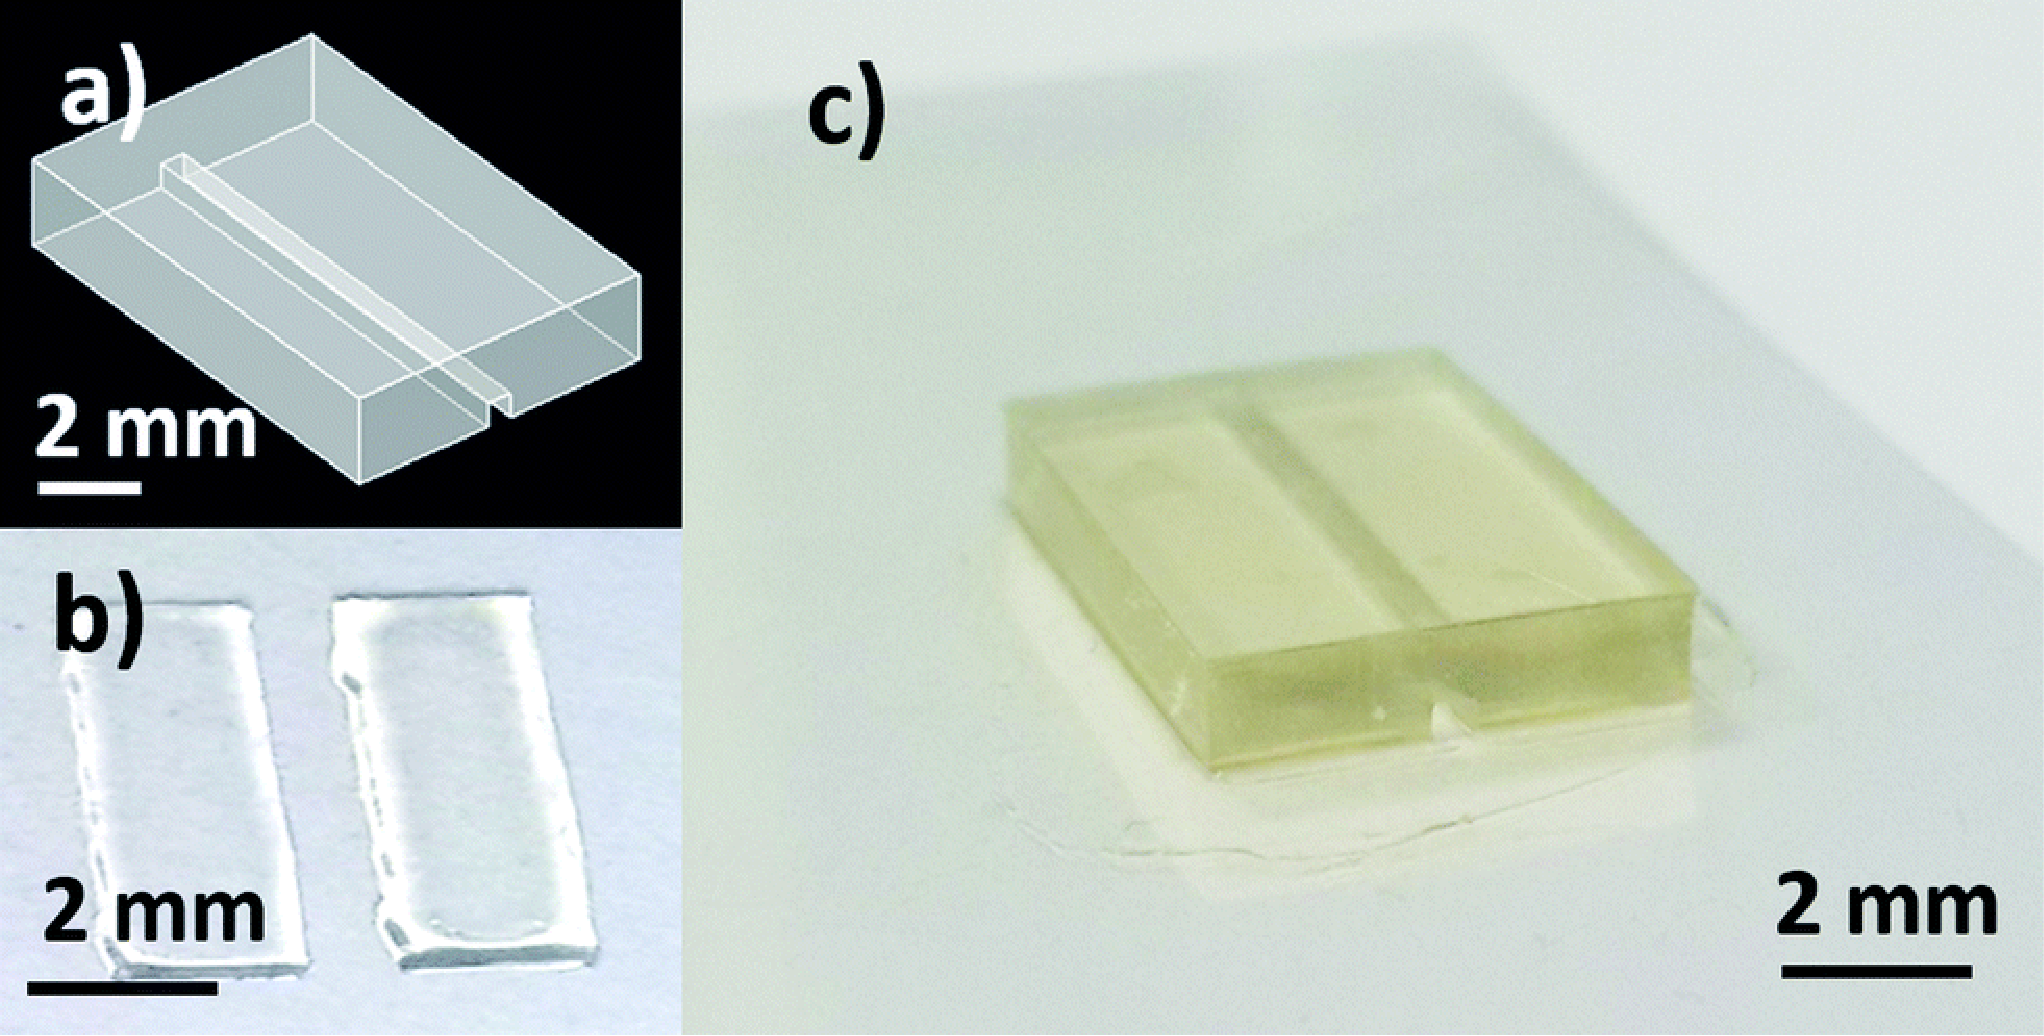
A build plate was manufactured with a 20 x 25 mm insert, shown in figure 1. Using a silicone gasket and a diaphragm vacuum pump (Masis, GZ35-12) a glass slide could be held in place during the printing process and quickly released afterwards. The glass slide protruded slightly from the plane of the build plate; this distance was measured and accounted for in the printer software. Mounting the glass flush with the edge of the insert made it possible to reference the edge of the glass in the software so that prints could be precisely aligned to the edges of the glass itself with better than 100 μm
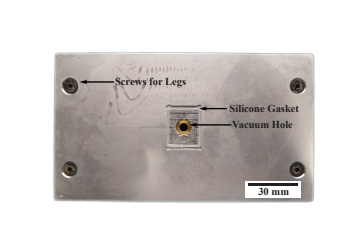
Figure 1: Modified build plate with insert for glass slide and silicone gasket and vacuum hole to hold glass substrate in place during printing.
Results
Diced borosilicate glass (BSG) substrates (Borofloat 33, University Wafer), 20 mm x 25 mm x 700 μm, were submerged in a 2.0 vol% solution of 3-(trimethoxysily) propyl methacrylate in ethanol (Bind-Silane, GE Healthcare, 17-1330-01) for five minutes, then submerged in ethanol for five minutes, and finally held at 105◦C for five minutes. This silane treatment protocol has been used to couple polymerizing hydrogel to a glass surface [29], but also worked to couple the resin used in this work to the glass without using an initial base layer.
Upon printing completion, the print was submerged in a solution of Resin Away (Monocure PTY LTD) and sonicated for 1 minute, or until all uncured resin was removed. The print and substrate were rinsed with deionized water and post-cured in B9 Model Cure (B9Creations, USA) for 20 seconds. Lab grade isopropanol was found to be less effective than Resin Away, as it would often cause the print to crack.
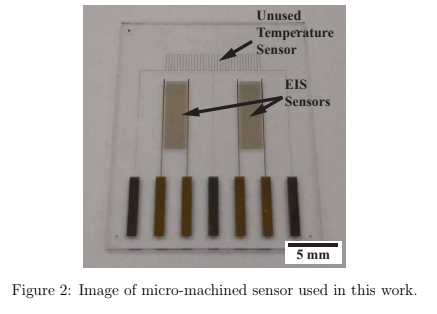
Physical vapor deposition (PVD) with thermal evaporation was used to deposit 10 nm of Cr adhesion layer, followed by electron-beam evaporation to deposit a 100 nm layer of Au onto a 700 μm thick, 100 mm BSG wafer. A positive photolithography process and wet chemical etch defined the patterned sensor, seen in figure 2. The wafer was diced into nine 20 x 25 mm sensors. These sensors were designed originally as temperature and electrochemical impedance spectroscopy (EIS) sensors, however in this work the temperature function was not utilized.
A flow chart outlining the fabrication process is shown in figure 3(a). Due to the limitation of the resin used in this work, printing closed channels was not deemed feasible. Instead, channels were printed open and a second print was used as a cover. The open channel and cover were each printed on glass and alignment features were designed on the open channel. A #3 round brush was used to lightly coat the contact surface of the open channel with uncured resin and then the cover was aligned and held firmly in place with a clamp during a post-cure process which fused the two prints together, resulting in a well-defined closed channel seen in figure 3(b). While using two prints to create closed channels was possible and repeatable, using a resin capable of closed channels would still be preferred in order to create a higher precision, single-step device
Replaceable 3D printed barb style adapters allowed tubing (1 mm ID, 3 mm OD, Tygon R-3603) to be connected to the flow channel for fluid introduction. Double-sided Kapton tape was used as an intermediate layer between the channel inlet/outlet and the barb adapter. While this was enough to secure the adapter for a short period of time, magnets (R422-N52, K&J Magnets) were used to secure the adapters for longer intervals with higher bursting pressure. These replaceable adapters seen in figure 3(b) and figure 3(c) resembled those used by Atencia et al but rather than a blunt needle, a barb connector was printed [30]. One of the advantages of printing adapters is that it can be assured that the liquid from the tube never interacts with the surface of the magnet.
The adapters were printed on glass without the use of base layers so that the sealing face of the adapters was smooth and consistent print to print. A 1 mm hollow punch was used to create a consistently sized hole in the tape and then the adapter was centered and pressed onto the tape. A 7 mm hollow punch was used to cut out the tape in a circle slightly larger than the adapter. When ready for use the protective sheet was removed from the backside of the tape and pressed onto the flow channel inlet/outlet. The tubing was attached to the barb adapter and a ring magnet fit around the tubing onto the adapter. A second, disc magnet (D42-N52, K&J Magnets) provided the clamping magnetic force from the backside of the substrate.
2.2. Component characterization
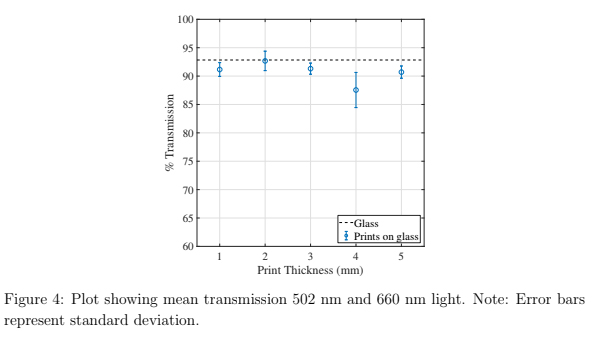
Light transmission through sample printed on glass was measured with a spectrophotometer (FastSpec 528, MicroLab, USA) to quantify optical clarity of printing on glass. The transmittance, defined as the ratio of light which passed through the sample to the incident light, was recorded in this manner. 502 nm and 660 nm light was emitted from an LED towards a light detector and the intensity was measured. Measurements were taken by placing a 3D printed sample between the LED and detector. One sample of each thickness was measured 5-10 times at these two wavelengths.
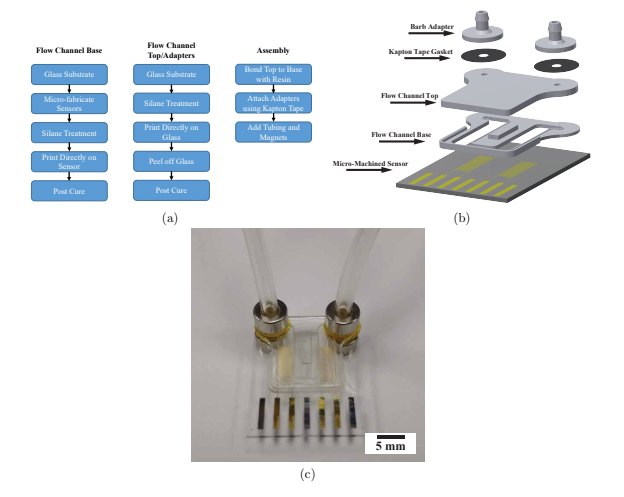
Figure 3: Fabrication process and image of device. (a) Flow chart of device fabrication. (b) Exploded view of designed sensor packaging. (c) Assembled device with tubing and magnets.
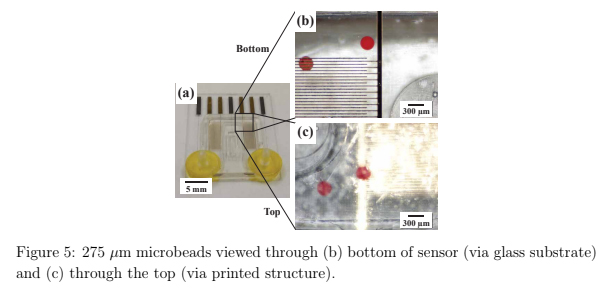
To demonstrate the improved image clarity provided by printing directly on a glass substrate, 275 μm microbeads (REDPMS-1.080 250-300μm, Cospheric, USA) were placed in a suspension solution and directed through the integrated flow channel on the sensor under a microscope. Images were collected viewing the microbeads through both the glass substrate and through the printed flow channel.
The bursting pressure of the magnetic adapters was tested in a similar manner to [30]. A printed solid cylinder and adapter were attached with a piece of Kapton tape. The printed cylinder simulated the flow channel to which adapters were attached. For consistency, cylinders were printed on glass and peeled off and post-cured with the glass side being the side to which the tape was affixed. Tubing connected the adapter to a 10 mL Becton Dickson syringe placed in a Kent Scientific GenieTouch syringe pump. The adapter end of the tubing was submerged in water so that the appearance of bubbles marked the point at which the connection began to leak. The volume of air in the tubing and syringe was noted. Approximating air as an ideal gas, the ideal gas law could be rearranged into Equation 1
P = PaVi/(Vi − dV )
where Pa is atmospheric pressure, Vi is the initial volume recorded, and dV is the volume dispensed by the syringe pump, respectively. The guaranteed pressure applied by the syringe pump for this specific syringe according to the manufacturer was approximately 6 atm. Atencia et al found a bursting pressure of approximately 5 atm using a similar procedure with Kapton tape and magnets [30].
2.3. Device characterization
Resistance measurements were performed on Au samples with identical deposition parameters in order to quantify the effect of the silane treatment on sensor performance. A custom-built co-linear four-point probe with 1.3 mm needle tip spacing and a Keithley 2450 SMU were used to conduct the measurements. Spherical spring-loaded testing tips with a diameter of 0.6 mm were used to guarantee a good electrical contact (uxcell P11J). Ten consecutive readings of each current polarity were acquired and averaged. This was repeated ten times for two samples before and after silane treatment.
In order to confirm no resin or other chemicals are left behind from the printing process or silane treatment, three sensors from the same process wafer were investigated with Raman spectroscopy. One sensor was left untreated, a second received the silane treatment, and the third received the silane treatment and the base of the flow channel was printed on the sensor. A spectra was collected from a spot both on the glass and the gold from each sensor with a Horiba Labram HR Evolution Raman spectrometer. Additionally, a scan of the cured resin was captured.
The impedance spectra of a conductivity standard (Biopharm 84 μS/cm) collected before and after printing, with and without magnets was obtained in order to confirm the sensor performance remained unchanged due to printing. Before applying the silane treatment and packaging the sensor, a flow channel with the same dimensions (not printed on glass) was printed and clamped on top of the sensor using a silicone gasket to seal the channel. Three spectra were obtained using a Hioki IM3536 LCR in the range of 1 kHz - 8 MHz, rinsing the flow channel with deionized water between measurements. Another three spectra were obtained with the magnets for the barb adapters in place. Three more spectra with and without magnets were obtained after printing was complete.
2.4. Sample applications
As a proof of concept application, various conductivity solutions were synthesized using conductivity standards (Biopharm) and deionized milli-Q water (GenPure xCAD Plus, Thermo Scientific, 18.2 MΩ cm). Solutions of 21, 42, 63, 84, 141 and 353 μS/cm were created using milli-Q water to dilute 84 and 1413 μS/cm conductivity standards with the assumption that the milli-Q water had an insignificant conductivity relative to the conductivity standards. Impedance spectra from 1 kHz - 8 MHz were collected in the same manner as described previously. A frequency of 100 kHz was chosen to calculate the conductivity. Using a linear model for the conductivity-temperature relationship shown in equation 2, a temperature coefficient α was calculated using equation 3

where κ and T were the measured conductance and temperature and κref and Tref were the advertised conductivity at the reference temperature of 25 ◦C, respectively.
As another proof of concept application, Escerichia coli K12 cells were suspended in milli-Q water and different dilutions were analyzed using impedance spectroscopy. A Petri dish was removed from refrigerator stock, and a single colony of E. coli K12 was scraped from a Petri dish, and introduced into a 50 mL Falcon tube containing 25 mL of 1X tryptic soy broth (TSB; BD Bacto). The Falcon tube was inserted into an incubator (37 ◦C) with orbital shaker (150 RPM) for 19 Hours. Subsequently, the Falcon tube was centrifuged at 4700 RPM for 10 min. TSB media was replaced from the Falcon tube with 25 mL of autoclaved milli-Q water and thoroughly mixed. Nine 1.5 mL micro-centrifuge tubes were arranged in linear sequence for dilution series. 1 mL of media containing E. coli K12 was pipetted from undiluted Falcon tube into a first micro-centrifuge tube, and was thoroughly mixed. Next, 100 μL of media was pipetted from first mixture, and combined with 900 μL of milli-Q water into second micro-centrifuge tube creating a 1:101 dilution of E. coli K12 cells to milli-Q water. This procedure was repeated until a dilution of 1:108 (ninth micro-centrifuge tube) from the original was reached. All steps were performed inside a biosafety cabinet to ensure sterile conditions.
To obtain cell counts, 100 μL of the final four dilution mixtures were pipetted onto Petri dishes containing tryptic soy agar (TSA; BD Bacto) and spread using glass spreaders. The Petri dishes were sealed with parafilm and left for 24 hours at room temperature to incubate. Cell concentrations were performed by counting the individual colony-forming units (CFU) established on each plate, multiplying by the level of dilution, and dividing by the amount of media pipetted.
Yang et al performed a similar experiment where Salmonella cells were suspended both water and phosphate-buffered saline (PBS) and the impedance response over a range of frequencies were recorded using interdigitated microelectrodes. It was found that cell concentrations could be distinguished down to 106 CFU/mL and higher in water, while cells suspended in PBS could not be distinguished [31].
3. Results and discussion
3.1. Component characterization
The transmittance of a blank glass slide yielded a value within 1 % of the theoretical transmission of approximately 92 % [32]. Parts printed directly onto glass resulted in transmission values less than that of glass, as seen in figure 4, but still averaged higher than 90 %. These data suggest that the 3D prints are not significantly scattering or absorbing the incident light, as the average transmittance is still within 5 % to that of glass.
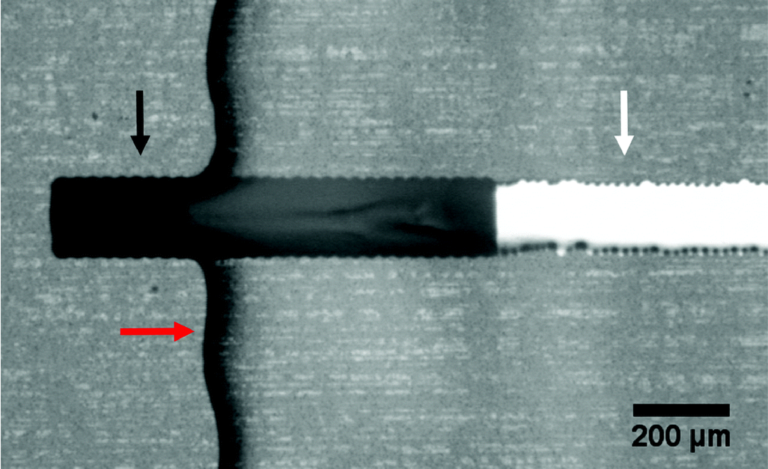
The packaged sensor can be seen in figure 3(b) and again in figure 5(a) with the barb adapters and yellow Kapton tape with magnets and tubing attached. Figure 5(b) shows how the relative position of the microbeads to each finger of the impedance sensor and channel wall is well-defined. In addition, the bead diameter is more easily determined which may be of interest with objects of unknown size. Note: The diameter of the used beads has an advertised variation of 50 μm and our measurements with a calibrated optical microscope were within this tolerance. In contrast, in figure 5(c) the relative microbead position and diameters are more challenging to determine.
During testing of the magnetic connectors, the syringe pump compressed the syringe past the advertised guaranteed force of the syringe pump with one or two exceptions. It’s possible the syringe pump is capable of applying more force than advertised, or approximating air as an ideal gas breaks down below 6 atm. In any case, the syringe pump was unable to cause the magnetic adapters to leak by nearly fully compressing 10 mL of air. This was deemed more than adequate for this work.
3.2. Device characterization
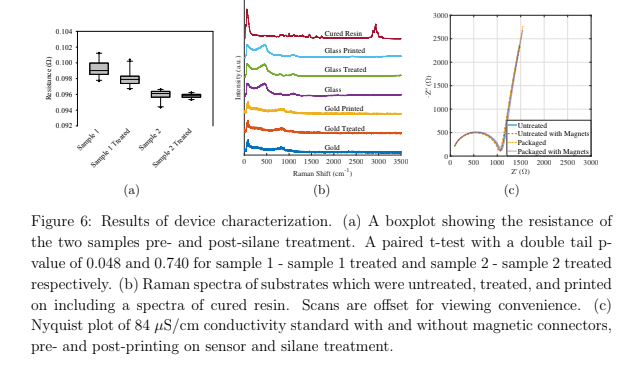
After performing the resistance measurements on two gold samples before and after silane treatment, a paired t-test with a double tail p-value of 0.048 and 0.740 was found for sample 1 (pre- and post-treatments) and sample 2 respectively, using the set of ten means. A boxplot showing these data is shown in figure 6(a). The p-values suggest the silane treatment has minimal effect on the resistance of Au used for the sensors in this work.
The Raman spectra are shown in figure 6(b) with the cured resin spectra shown first followed by the glass and gold surfaces pre- and post-silane treatment and post-printing. All gold and glass substrates look alike regardless of silane treatment or printing and none show the peaks of the cured resin around 3000 cm−1 . This suggests that no resin or other chemicals are left on surfaces.
Impedance spectroscopy measurements were performed to evaluate sensor performance before and after the printing on the sensor. These data are plotted in a Nyquist diagram, which shows the real resistance versus the negative imaginary resistance. The curves of the Nyquist plot overlap in figure 6(c) suggesting that sensor performance is negligibly affected by the printing process.
3.3. Sample applications
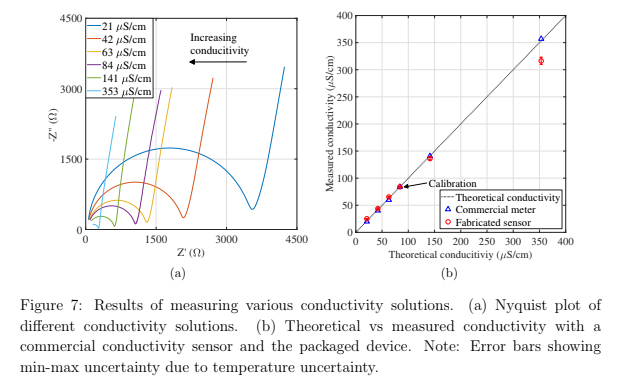
The six conductivity solutions can be clearly distinguished in a Nyquist plot in figure 7(a). The experimental cell constant of 0.0832 cm−1 was found by comparing a commercial conductivity meter (Omega, CDS107). Using the linear temperature conductivity model described in equation 2 and equation 3, the conductivity of the various solutions was calculated and plotted in figure 7(b). The error bars show the min-max uncertainty due to temperature uncertainty. Also plotted is the measured conductivity by the commercial meter. The sensor measured conductivity values within
8 % of the meter with the exception of the lowest and highest conductivity solutions which each varied by more than 12 % from the meter. The working range of the sensor is affected by both the cell constant and the linear temperature compensation model.
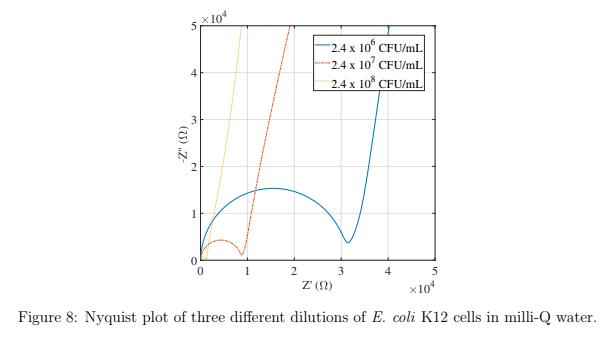
2.4 x 10⁷ and 2.4 x 10⁸ CFU/mL) of suspended E. coli K12 cells and the Nyquist curves are shown in figure 8. The three dilutions are clearly distinguished in this plot and show that this packaged sensor is capable of distinguishing concentrations of bacterial cells down to 2.4 x 10⁶ CFU/mL. It was found that lower concentrations of cells could not be distinguished, therefore the detection limit for this sensor is 2.4 x 10⁶ CFU/mL for E. coli K12 cells suspended in water.