Ultrasensitive and rapid quantification of rare tumorigenic stem cells in hPSC-derived cardiomyocyte populations

Zongjie Wang 1 2, Mark Gagliardi 3 4, Reza M Mohamadi 5, Sharif U Ahmed 5, Mahmoud Labib 5, Libing Zhang 5, Sandra Popescu 5, Yuxiao Zhou 5, Edward H Sargent 1, Gordon M Keller 3 4 6, Shana O Kelley 2 5 7

The ability to detect rare human pluripotent stem cells (hPSCs) in differentiated populations is critical for safeguarding the clinical translation of cell therapy, as these undifferentiated cells have the capacity to form teratomas in vivo. The detection of hPSCs must be performed using an approach compatible with traceable manufacturing of therapeutic cell products. Here, we report a novel microfluidic approach, stem cell quantitative cytometry (SCQC), for the quantification of rare hPSCs in hPSC-derived cardiomyocyte (CM) populations. This approach enables the ultrasensitive capture, profiling, and enumeration of trace levels of hPSCs labeled with magnetic nanoparticles in a low-cost, manufacturable microfluidic chip. We deploy SCQC to assess the tumorigenic risk of hPSC-derived CM populations in vivo. In addition, we isolate rare hPSCs from the differentiated populations using SCQC and characterize their pluripotency.

We kindly thank the researchers at University of Toronto for this collaboration, and for sharing the results obtained with their system.

Introduction

Human pluripotent stem cells (hPSCs) hold great promise for cell therapy given their ability to differentiate into many different cell types (1). Numerous studies have demonstrated the considerable potential of hPSC derivatives in treating chronic diseases, including neuron degeneration (2) and chronic heart failure (3). Typically, a dose of cell therapy for treating heart failure requires 0.1 to 1 billion of de novo hPSC-derived functional cells (4); therefore, the translation of cell therapy from bench to bedside heavily depends on reliable manufacturing of high-quality cell products (4–6).

The self-renewal and pluripotent properties of hPSCs are also associated with a high level of tumorigenicity in vivo (7). Undifferentiated cells can persist in differentiated populations following long periods of time in culture (8, 9), and rare contaminating hPSCs, even at concentrations less than 0.025%, can lead to teratoma formation in animal models (10–12). As a result, quantitation of the percentage of rare hPSCs is a key quality control parameter that needs to be monitored in manufactured populations to be used for cell therapy applications (4, 13).

Flow cytometry (FCM) and the polymerase chain reaction (PCR) are powerful methods for the analysis of rare cells. Unfortunately, neither of these methods is sensitive enough to rapidly and accurately identify rare hPSCs in relevant samples. FCM has intrinsic limitations including sampling losses and dead volumes (14) that reduce accuracy at exceptionally low levels of hPSC contamination that may still represent a potential risk of tumor formation (15). PCR-based methods are often problematic due to the high background from differentiated cells relative to the rare undifferentiated controls (16) and reverse transcription–induced artifacts, including primer-independent complementary DNA (cDNA) synthesis and template switching (17).

Here, we report a new approach to the quantitation of rare undifferentiated cells: stem cell quantitative cytometry (SCQC). This method takes advantage of a rare cell profiling approach based on a strategy for monitoring cancer cells (18, 19). SCQC uses a microfluidic chip that is scalable, cost-effective, and compatible with the requirements of manufacturing and quality control. SCQC has excellent sensitivity and is able to profile rare hPSCs robustly even when present at concentrations as low as 0.0005% in populations of hPSC-derived cardiomyocytes (CMs). Through the analysis of CM samples containing defined numbers of spiked hPSCs, we demonstrate that SCQC detects rare contaminants with unprecedented performance. Comparative studies show that SCQC can accurately quantify hPSCs at levels that are not reliably detected by either FCM or droplet digital PCR (ddPCR). Last, we use SCQC to isolate live rare hPSCs from differentiated CM populations and characterize their pluripotency.

Materials

Master Mold Resin

Results

Development of microfluidic SCQC
The device used for SCQC relies on immunomagnetic labeling to profile cells based on their surface marker expression (Fig. 1A) (20). Cells are labeled with magnetic nanoparticles (MNPs) that bind to a surface marker expressed by hPSCs, but not CMs. Labeled cells are subsequently introduced into a microfluidic device with a flow velocity gradient and a constant magnetic field (Fig. 1, A to C, and fig. S1, A and B). Cells with more MNPs experience a higher magnetic force to compensate the downstream drag force generated by the flow velocity. As a result, the hPSCs that bind more MNPs than the differentiated CMs can withstand high flow velocities and remain in the high-velocity regions of the device. The CMs with few or no MNPs are captured in the low-velocity regions or flushed away. At the completion of the run, the cells trapped in the microfluidic device are quantified by immunofluorescence and microscopy to generate a cytometric profile that includes number, phenotype, and distribution of trapped cells. The information from the cytometric profile provides an assessment of the total number of hPSCs.
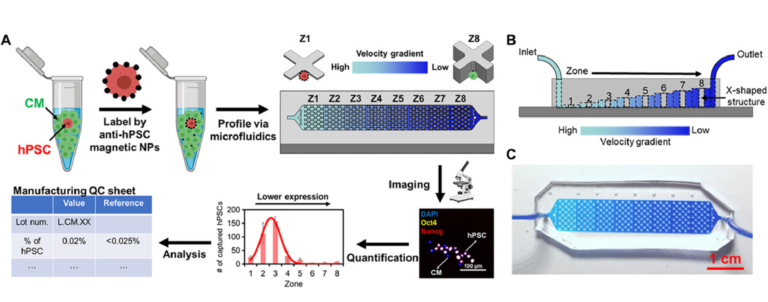
Fig. 1 SCQC for rare stem cell analysis.
(A) Overview of the SCQC approach. Cells are labeled with MNPs functionalized with an antibody against specific stem cell surface markers. Labeled cells are magnetically captured in a 3D-printed microfluidic device with a flow velocity gradient. Stem cells labeled by a high number of MNPs can withstand higher flow velocities and are captured in earlier zones. The number of stem cells in each zone is quantified by immunostaining and microscopy to generate a cytometric profile that can be used for further analysis. (B) Illustration of the microfluidic device for SCQC. Eight sequential capture zones with a decreasing flow velocity gradient are generated by linearly increasing the channel height. (C) Picture of the fabricated device. A dye-containing solution was introduced into the channel to visualize the changes in channel height. Error bar indicates the SD of the mean from three experiments (B).

Sensitivity and specificity of SCQC

We used the HES2 hPSC line and derivative CMs to characterize and optimize the performance of SCQC. The CMs were differentiated for at least 20 days following an established protocol (fig. S2) (21, 22). The hPSC-derived CMs contain more than 85% cardiac troponin T (cTNT)–positive cells. In the first suite of experiments, we used FCM to benchmark eight surface markers (SSEA-1, SSEA-4, TRA-1-60, TRA-1-81, EpCAM, CD90, CD9, and E-cadherin) and three intracellular markers (Oct4, SOX2, and Nanog) for distinguishing hPSCs and hPSC-derived CMs (fig. S3). FCM results revealed that TRA-1-60 and EpCAM offer the highest separation (equivalently the best contrast) among all markers. Hence, we chose TRA-1-60 and EpCAM MNPs for on-chip optimization.

HES2 hPSCs or derivative CMs were labeled with antibody-conjugated MNPs, profiled using SCQC and stained by a (4′,6-diamidino-2-phenylindole) DAPI/NucDead 488 cocktail for visualization (fig. S4A). TRA-1-60 MNPs produced higher levels of hPSC capture and hPSC-derived CM depletion (fig. S4B) than EpCAM MNPs. We also investigated the specificity of the TRA-1-60 MNPs for labeling hPSCs by transmission electron microscopy (fig. S4C). More than 10 major clusters of MNPs were observed on the surface of hPSCs, while 0 or 1 major cluster of MNPs was detected on the CMs. On the basis of these findings, we concluded that the TRA-1-60 has enhanced performance for capturing rare hPSCs in hPSC-derived CMs compared with other surface markers. Next, we tested the direct isolation of hPSCs using TRA-1-60 MNPs via magnetic-activated cell sorting (MACS). However, MACS had poor capture and recovery efficiency for both live and fixed cells (fig. S5). Notably, around 20% of cells, regardless of cell type, remained trapped in the columns and could not be recovered. This is consistent with previous studies (23, 24). Therefore, it is necessary to use the microfluidic chip to enable more efficient recovery and in situ immunostaining of rare cells for quantification.

We next assessed the specificity of SCQC to evaluate its utility for the quantitation of undifferentiated hPSCs. In the absence of an external magnetic field or the absence of MNPs, less than 0.05% hPSCs were captured at the flow rate of 2 ml/hour. Subsequently, the flow rate, which dominates the flow velocity on-chip, was optimized to balance the capture of hPSCs and the depletion of hPSC-derived CMs (fig. S4D). At the optimized flow rate (10 ml/hour), we captured 85.7% of hPSCs while depleting 99.7% of CMs (Fig. 2, A and B). Over 90% of captured hPSCs were detected in zones 1 to 5, which generates a reproducible cytometric profile. In addition, we characterized the dynamic range of the SCQC using the optimized flow rate. The chip had a consistent capture efficiency and cytometric profile in the range of 0 to 5000 hPSCs (Fig. 2C and fig. S4E). The chip offered sufficient depletion (>99%) up to 500,000 CMs (fig. S4E). Also, the chip maintained a consistent capture performance when using other hPSC cell lines, including an induced pluripotent stem cell line (fig. S4F) and other hPSC-derived populations (i.e., definitive endodermal cells) (fig. S4G). On the basis of these results, we conclude that SCQC is a highly sensitive and selective method with an excellent dynamic range for the capture and analysis of hPSCs.
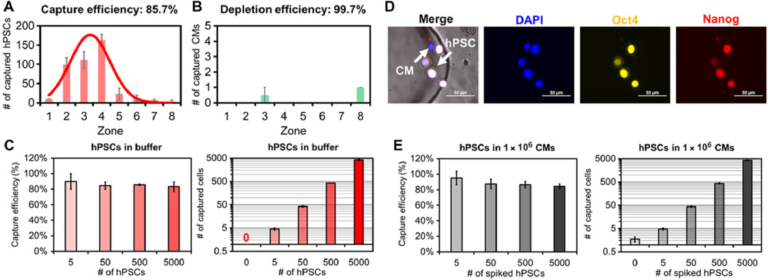
Fig. 2 Characterization of sensitivity and selectivity of the SCQC approach. (A and B) Representative cytometric profiles of captured (A) hPSCs and (B) hPSC-derived CMs at the flow rate of 10 ml/hour (n = 3). (C) Capture performance of hPSCs in CM-free buffer (n = 3). (D) Representative microscope images of captured hPSCs in CMs. HPSCs are quantified as DAPI+, Oct4+, and Nanog+. (E) Capture performance of hPSCs spiked in 1 million hPSC-derived CMs (n = 4). Error bar indicates the SD of the mean from all experiments (A to E). Cell capture experiments (A, C, and E) were performed at the flow rate of 10 ml/hour and the volume of 1 ml. The number of hPSCs (A) or CMs (B) was 500.

We determined the limit of detection (LOD) of SCQC using samples of hPSC-derived CMs spiked with defined numbers of hPSCs. As the SCQC device nonspecifically captures a small fraction of hPSC-derived CMs, immunostaining was used to quantify the number of hPSCs on the fluidic chip. The hPSCs were defined using a cocktail of DAPI, Oct4, and Nanog (Fig. 2D). We found that SCQC can clearly identify the difference between the negative control (zero hPSC in 1,000,000 hPSC-derived CMs) and the 0.0005% sample (five hPSCs in 1,000,000 hPSC-derived CMs as shown in Fig. 2E). Hence SCQC achieves a LOD of 0.0005% for quantifying rare hPSCs.

Quantitative comparison between SCQC, FCM, and ddPCR

We conducted a comparative study to systematically evaluate the performance of SCQC, FCM, and ddPCR for rare hPSC detection. We generated populations of hPSC-derived CMs containing 0.01 to 5% of spiked HES2 hPSCs. For FCM, we used TRA-1-60 and EpCAM as the hPSC markers with a two-laser six-color flow cytometer. For ddPCR, we monitored the expression of three hPSC genes: POU5F1, SOX2, and CD326. TBP or B2M was included as a housekeeping control. For SCQC, we applied the TRA-1-60 MNPs and the flow rate of 10 ml/hour, as detailed above.

The representative profiles obtained by FCM are shown in Fig. 3A and fig. S6A. The hPSC signal (TRA-1-60+ EpCAM+) decreased rapidly with the decreasing number of hPSCs. FCM was unable to detect hPSCs in the 0.1% sample, as the signal for these samples was the same as the signal for the samples that did not contain hPSCs. The combination of the two most sensitive markers (TRA-1-60/EpCAM) yielded the optimal LOD around 0.2% to 0.3% (see fig. S6, A and B). Previous literature suggests that the number of total events that must be collected to detect a population present at a frequency of 0.1% is at least 10 million (25). Routine collection of 10 million events by FCM is neither cost- or time-effective.
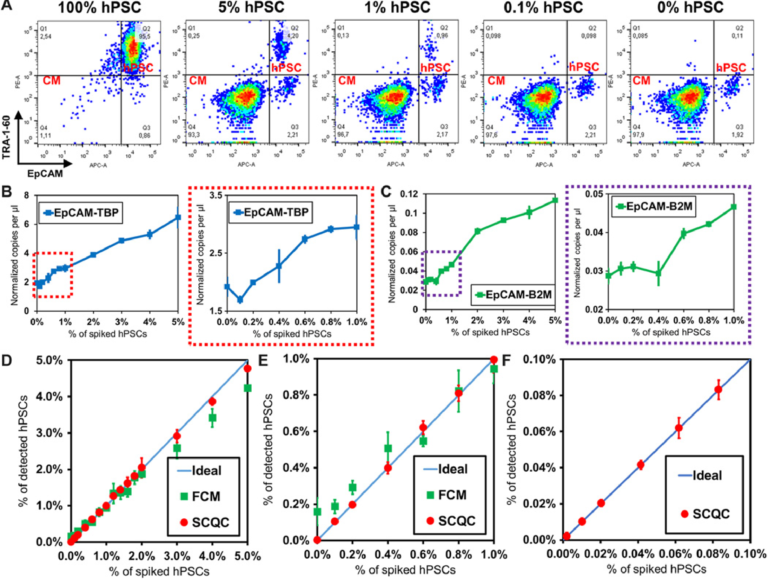
Fig. 3 Benchmarking the performance of SCQC, FCM, and ddPCR for rare hPSC quantification. (A) Representative cytometric profile of FCM for samples with spiked hPSCs. (B and C) Detection performance of ddPCR using EpCAM and (B) TBP or (C) B2M as the housekeeping control for normalization. (D to F) Detection performance of SCQC and FCM in the range of (D) 0 to 5%, (E) 0 to 2%, and (F) 0 to 0.1% (n = 3 for SCQC, FCM, and ddPCR; 50,000 cells were analyzed for each replicate). Error bar indicates the SD of the mean from three experiments (B to F). Cell capture experiments (D to F) were performed at the flow rate of 10 ml/hour using a total volume of 1 ml. Each cell suspension contained 50,000 hPSC-derived CMs spiked with various amounts of undifferentiated hPSCs in the desired final concentration, as indicated on the x axis.

The representative ddPCR results are shown in Fig. 3, (B and C) and fig. S6 (C and D). From the three primer sets tested (POU5F1, SOX2, and EpCAM), we found that the combination of EpCAM as the target and TBP as a housekeeping gene yielded the lowest LOD, calculated at 0.2 to 0.4% (Fig. 3B). The LOD obtained using POU5F1 and SOX2, which are the definitive genes for pluripotency, was higher than 1% (fig. S6D). This is not an unexpected result as previous literature has indicated that pluripotent genes (i.e., POU5F1, SOX2, Nanog, Klf-4, and Lin28) are weakly expressed at the RNA level in hPSC-derived cells, typically in the range of 0.01 to 1% relative to undifferentiated hPSCs (16, 26). As a result, the signal from rare hPSCs is concealed by the large background generated by a substantial excess of hPSC-derived cells. Therefore, given the lack of a specific hPSC marker, ddPCR is not a practical method for quantifying rare hPSCs in differentiated population.

We summarized the comparative results in Fig. 3 (D to F). The LOD of SCQC, FCM, and ddPCR is <0.01, 0.2 to 0.3, and 0.2 to 0.4%, respectively (table S1A). In addition to having a superior LOD, SCQC also offered the best linearity of detection (R2 > 0.99) among the three technologies (table S1B). On the basis of this comparative study, it is clear that SCQC outperforms the existing cell detection methods when quantifying rare hPSCs in batches of differentiated CMs. In addition, SCQC also has other advantages for cell manufacturing including cost-effectiveness, scalability, and compatibility with the U.S. Food and Drug Administration Current Good Manufacturing Practice (cGMP) regulations (27) (table S2). SCQC facilitates accurate detection and quantitation of undifferentiated cells within an hour at a cost of $30 per chip per run. Given its compact design and scaled fabrication method, this technology can be easily set up to support parallelized and large-scale operations.

Analysis of the tumorigenicity of rare hPSCs

To benchmark whether the performance of SCQC is relevant for the analysis of batches of therapeutic cells, we used SCQC to assess the tumorigenicity of samples containing different levels of hPSCs (Fig. 4). We prepared samples of hPSC-derived CMs (1 million) spiked with different numbers of hPSCs to yield contamination frequencies of 0.03 and 0.3%. CM populations with no additional hPSCs (0%) were used as controls. The three samples were injected into the testis of male NOD/SCID/Gamma (NSG) mice (Fig. 4A) to measure teratoma potential. A small portion (50,000 cells) of each sample was used for hPSC detection by SCQC and FCM analyses (Fig. 4B). As shown in Fig. 3B, SCQC was the only technology that correctly identified the percentage of hPSCs in differentiated CMs before injection. FCM analysis failed to distinguish the differences among three samples [P > 0.05 when performing the analysis of variance (ANOVA) between any of two samples].
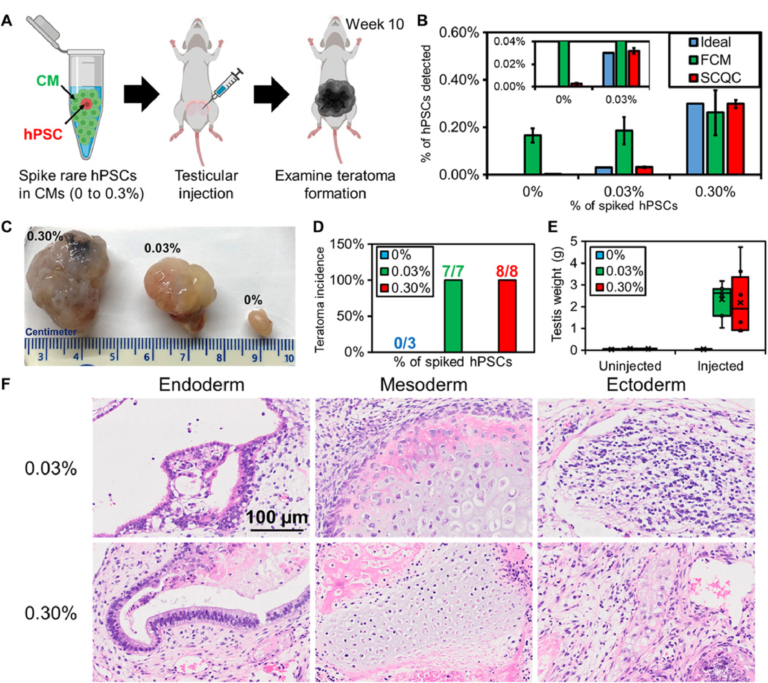
Fig. 4 Rare hPSCs form teratomas in vivo. (A) Workflow of the teratoma-forming assay. Exogenous rare hPSCs were spiked into hPSC-derived CMs to form cell mixtures for testicular injection. After 10 weeks, the mice were euthanized to examine teratoma formation. (B) Quantification of hPSC concentration in the samples used for injection (n = 3 for SCQC and n = 5 for FCM). (C) Representative pictures of fixed teratoma from 0% hPSCs, 0.03% hPSCs, and 0.3% hPSCs and to hPSC-derived CMs. (D) Percentage of teratoma formation in mouse models. (E) Weight of teratoma in mouse models. (F) The 0.03% and 0.30% hPSCs added to hPSC-derived CMs can form a mature teratoma that contains three germ layers, as visualized by histology. Error bar indicates the SD of the mean from all experiments (B). Whisker, box, cross, and horizontal line indicate the minimum/maximum, first/third quartile, mean, and median from each group, respectively (E). Dots represent data points (E). Cell capture experiments (B) were performed at the flow rate of 10 ml/hour using a total volume of 1 ml. Each cell suspension contained 50,000 hPSC-derived CMs spiked with various amounts of undifferentiated hPSCs in the desired final concentration, as indicated on the legend.

All the mice in both experimental groups developed teratomas after 10 weeks (Fig. 4, C and D). The averaged testis weight in the 0.03 and 0.3% hPSC group underwent a marked increase from 0.1 g to over 2 g (Fig. 4E). Conversely, mice in the control (0%) group were teratoma free, and no significant change in testis was found. This result matched with the previous studies that showed that populations consisting of 0.025% hPSCs diluted in feeder fibroblasts could initiate teratoma formation within 12 weeks (28).

We further characterized the teratomas by histopathology (Fig. 4F) and detected multiple cell types including pancreatic, respiratory, and intestinal epithelium (endoderm); cartilage, bone, fibrous, and adipose connective tissue (mesoderm); and melanocytes and glial cells (ectoderm). The histopathological finding indicates that the hPSCs retain strong pluripotency and are capable of developing mature tumors in vivo. Together, these findings demonstrate that quantification of rare hPSCs with an LOD of 0.03% or lower is required to avoid the formation of teratoma in animal models. However, the minimal number of hPSCs that is sufficient to form teratoma remains unclear and will depend on several variables including the hPSC cell line, the number of injected cells, the format of injected hPSCs (clumps or single cell), and the site of injection (29, 30). While determining this number was beyond the scope of this study, we envision being able to take advantage of the sensitivity of SCQC to determine the number of hPSCs required to form teratoma under a clinically relevant dosage.

Isolation and characterization of live rare hPSCs
Isolating live rare hPSCs in hPSC-derived CMs may provide insights into the origins of heterogeneity for in vitro differentiation processes. We next applied SCQC to the isolation and characterization of live rare hPSCs in CM populations. For these studies, we generated CM populations from HES2 and HES3-NKX-2.5GFP hPSCs using both monolayer- and embryoid body (EB)–based protocols and profiled the samples using SCQC. After capture, the external magnetic field was removed, and the cells in the chips were isolated and expanded in culture (Fig. 5A).
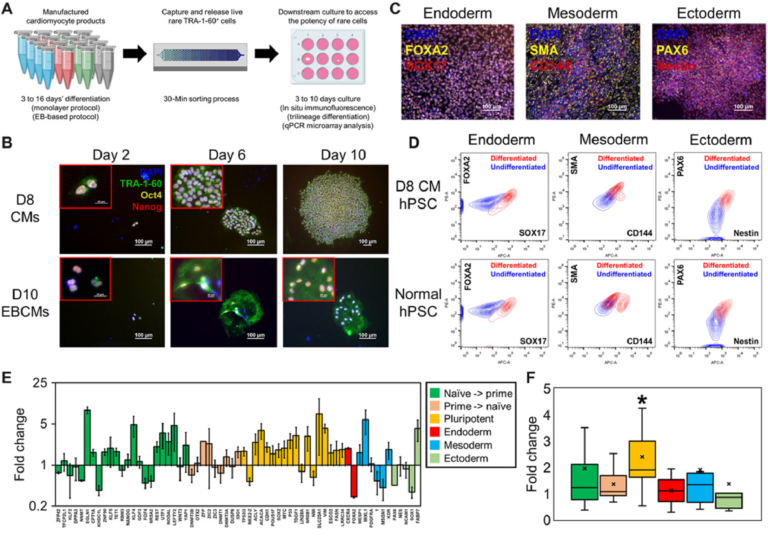
Fig. 5 Isolation and characterization of live rare hPSCs from manufactured batches of CMs using SCQC.
(A) Workflow of the live cell isolation. Batches of hPSCs-derived CMs were profiled using SCQC. Captured rare TRA-1-60+ cells were recovered and cultured up to 15 days for analysis. (B) Representative microscope images of colony-forming rare TRA-1-60+ cells from hPSC-derived CMs cultured in a monolayer (day 8) and as EBs (day10). The colony-forming cells maintained a high level expression of Oct4 and Nanog (n = 3 to 8). (C and D) Assessment of the pluripotency of rare hPSCs. Rare hPSCs were successfully differentiated into endoderm [FOXA2+ and SOX17+], mesoderm [SMA+ or CD144+ cells], and ectoderm [PAX6+ and Nestin+] as quantified by (C) IF and (D) FCM. (E and F) Analysis of the pluripotency-related gene expression of rare hPSCs (normal hPSCs as control). (E) Microarrayed mRNA profile of rare hPSCs (n = 4). (F) Global analysis of the state of rare hPSCs. Rare hPSCs hold a higher expression of pluripotency-related mRNA (*P < 0.05). Error bar indicates the SD of the mean from four experiments (E). Whisker, box, cross, and horizontal line indicate the minimum/maximum, first/third quartile, mean, and median from each category of genes, respectively (F).

We initiated live cell experiments by optimizing the capture and culture conditions using CM populations containing spiked pluripotent HES2 hPSCs at the frequencies of 0.01 and 0.03%. We slowed the flow rate to 4 ml/hour to secure a capture efficiency of 90 to 95%. After capture, cells were released from the SCQC chips and cultured in StemFlex medium. This medium contains bovine serum albumin (BSA) and heat-stable fibroblast growth factor (FGF), which better support the survival of rare hPSCs. After 15 days of culture, no hPSCs were detected in the negative groups that contain the cells released from the chips (fig. S7A). In contrast, we observed the formation of multiple colonies in positive groups from 0.01 and 0.03% samples (fig. S7A). It typically took 6 to 10 days to allow the rare hPSCs to recover and grow from a single cell to a colony. No noticeable internalization of TRA-1-60 MNPs was observed, and 98.5% of MNPs on the cell membrane detached in 2 days (fig. S7B). The floating MNPs were removed during regular medium change. This allows the rare hPSCs to grow in an MNP-free environment to avoid unwanted cell-MNP interaction that could hamper cell function over long time periods (31). In addition, the CMs in the negative groups were found to adhere and form a network of cells within 3 days and formed beating monolayers at day 6. This demonstrated that SCQC is a gentle cell sorting method that poses minimal stress on profiled cells.

We next proceeded to profile the differentiated batches of cardiac cells generated from monolayer-based [D4 cardiac progenitor cells (CPCs) and D8, D12, and D16 contracting CMs] and EB-based differentiation protocols (D3 CPCs and D10 and D20 contracting CMs). The phenotypes of the manufactured batches of cells were characterized as shown in fig. S7C (percentage of cTNT+ cells) and fig. S7D (representative images and video clips showing the contractility of the samples). We captured rare hPSCs in all CPC samples (three of three) (fig. S7E), most of the D8 samples (two of three) (Fig. 5B), and some of the D10 samples (two of eight) (Fig. 5B). We did not find any rare hPSCs in the D12, D16, and D20 samples. These results indicate that the rare hPSCs are mostly present in early CPCs and CMs undergoing the maturation process (D8 to D20). They also show that expression of mature cardiac markers is not an indication of a lack of rare hPSCs, as undifferentiated cells were detected in day 10 EB populations that contained greater than 75% cTNT+ cells.

Next, we characterized the pluripotency of the rare hPSCs isolated from D8 HES2 hPSC–derived CMs. At the phenotypic level, a trilineage differentiation was performed to verify the pluripotency. The rare hPSCs retained the capacity to differentiate into FOXA2+ SOX17+ definitive endoderm, SMA+ smooth muscle cells or CD144+ endothelial mesoderm-derived cells, and PAX6+ Nestin+ neural stem cells, as verified by immunofluorescence (Fig. 5C and fig. S7F) and FCM (Fig. 5D). To characterize gene expression, a quantitative polymerase chain reaction (qPCR) microarray was used to analyze the expression of key pluripotent, naïve, primed, and differentiated genes. Compared with the standard unsorted HES2, the rare hPSCs had little alteration in the expression of key genes as all fold changes remained in the range of 0.3 to 9. The highest up-regulated and down-regulated genes were EGLN1 (8.6-fold) and KHDC1L (0.37-fold), respectively (Fig. 5E). However, global analysis revealed that the rare hPSCs had statistically higher expression of pluripotent markers (P = 0.02). Together, the characterization here demonstrates the feasibility of using SCQC for identifying and isolating rare cells in hPSC-derived differentiated populations.

DISCUSSION

The SCQC method described here provides an ultrasensitive, rapid, inexpensive, and scalable means of quantifying and isolating rare hPSCs in hPSC-derived CM populations. This approach is more sensitive and cost-effective than conventional methods including FCM and ddPCR. In a manufacturing environment, SCQC provides an effective way to monitor the quality of the manufactured population with respect to the presence of contaminating hPSCs.

In addition, we found that the rare hPSCs can be detected in populations of CPCs and immature CMs using SCQC. This highlights and validates the safety concerns surrounding stem cell–based cell therapy, especially for the therapies involving progenitors and differentiated cells at the early stage. As these cells have been used in small-scale clinical trials (32, 33), the quality assessment enabled by the SCQC is critical to fulfilling the demand of safeguarding cardiovascular cell therapies (34, 35).

In general, the concept underlying SCQC is broadly applicable to all surface markers and even intracellular mRNAs via the sequence-specific MNPs clustering (36). Hence, the implementation of the SCQC can be easily extended to the quantification of other rare cells in therapeutic products or patient samples, such as circulating tumor cells and chimeric antigen receptor therapy (CAR-T). Recent work has highlighted the importance to improve manufacturing technologies to quantify rare misprogrammed leukemic B cell for safeguarding CAR-T therapy (37).

MATERIALS AND METHODS

Device design and simulation
The SCQC device implements a fluidic channel with increasing heights to generate a flow velocity gradient with eight discretized flow velocities, which correspond to eight capture zones (Fig. 1B). The height of the first zone is 50 μm, and the stepwise increment is 50 μm per zone. X-shaped structures within the microfluidic device generate capture pockets that significantly improve trapping efficiency (20). Numerical simulations of the flow velocity profiles were carried out by COMSOL Multiphysics (version 5.3; COMSOL Inc., USA) using 3D creeping flow module. The key parameters were set as below: wall condition, no slip; boundary condition, pressure of 0 Pa; suppression of backflow, yes; mesh size, physics-controlled, normal; vector field shape, normal inflow velocity; and inlet velocity rate, 3.5 mm/s. The simulated flow velocity field was processed by MATLAB R2017b (MathWorks, USA) to extract the normalized linear velocity per zone. Simulated results suggest that the normalized flow velocities range from 100 (1×) to 14% (0.14×) (fig. S1, A and B). The multidepth design has two major advantages over the previously reported planar design (19, 20, 36). First, the device remains compact when adding more zones, which reduces the fabrication cost and accelerates the microscope scan. Second, manipulating heights offers easy and fine control over the flow velocity gradient.

Design of fabrication workflow
The fabrication of multidepth microfluidic devices usually involves multiple photolithography and mask-alignment processes that markedly reduce the cost-effectiveness and scalability (38). Although three-dimensional (3D) printing has shown the potential to provide a rapid solution for fabricating multidepth microfluidic devices, existing techniques could not achieve high resolution (dot feature sizes <200 μm) in a cost-effective and robust manner (39–42). To overcome these challenges, we carefully optimized the printing conditions of a desktop stereolithographic 3D printer with a pixel size of 30 by 30 μm (fig. S1C). The 3D printer supports the formation of positive structures (i.e., microposts) compared with negative structures (i.e., microwells). The minimal printable dot and line feature is 100 and 30 μm, respectively. This optimized condition allows the successful fabrication of various positive multidepth structures with a maximal aspect ratio up to 5 (fig. S1D) within an hour at the material cost of $50. To further improve the throughput and reduce the cost, multiple molding processes have been introduced (fig. S1E). Negative molds are first generated by casting polydimethylsiloxane (PDMS) on 3D-printed positive molds. The negative molds are subsequently treated by detergent and used as a new mold to generate the microfluidic devices. In this way, one 3D-printed mold can create multiple PDMS molds for mass production. We have achieved a throughput of 40 devices per day per operator at the laboratory scale and reduced the cost to $4 per chip. The details of the X-shaped structures with high aspect ratios can be transferred properly, granting the high quality of fabricated chips (fig. S1F). The measured thickness of each zone is within ±4% of the designed thickness (fig. S1G).

Device fabrication
Positive molds were fabricated by a stereolithographic 3D printer (μMicrofluidics Edition 3D Printer, Creative CADworks, Canada) using the “CCW master mold for PDMS” resin (Resinworks 3D, Canada). The layer thickness is set to 50 μm. Negative molds were fabricated by casting PDMS (Dow Chemical, USA) on positive molds and baked at 70°C for 2 hours. Negative molds were then treated by saturated detergent solution (Sparkleen, Thermo Fisher Scientific, USA) in 70% ethanol at room temperature (RT) for at least an hour. PDMS-positive replicas were generated by casting PDMS on negative molds and baked at 70°C for 2 hours. The cured replicas were then peeled off, punched, and plasma bonded to thickness no. 1 glass coverslips (Ted Pella, USA). The bonded chips were left in a 100°C oven for 30 min to secure a robust bonding. Afterward, the silicon tubing was attached to the inlet and outlet of the device. Before use, the devices were conditioned with 1% Pluronic F68 (Sigma-Aldrich, USA) in phosphate-buffered saline (PBS) for at least 1 hour to reduce the nonspecific adsorption. Each device was sandwiched between two arrays of N52 NdFeB magnets (K&J Magnetics, USA; 1.5 mm by 8 mm) with alternating polarity. A syringe pump (Chemyx, USA) was used for the duration of the cell capture process.

Device characterization
For the characterization of microstructures, printed positive molds, PDMS negative molds, and PDMS positive replicas were sputter coated with 20-nm Au (Denton Desk II, Leica, Germany) and observed under field emission scanning electron microscopes (Hitachi SU-5000 or FEI Quanta FEG 250) using 5-kV accelerating voltage. PDMS-positive replicas were also measured by a thickness gage (Mitutoyo, Japan) to determine the thickness of each zone.

Culture of hPSC lines
 HES2 (karyotype: 46, XX) was purchased from WiCell (USA). The HES3-NKX-2.5GFP reporter cell line (karyotype: 46, XX) was provided by E. Stanley and A. Elefanty (Monash University, Australia). BYS-0113 (karyotype: 46, XY) was purchased from the American Type Culture Collection (USA). hPSCs were maintained on Matrigel (Corning, USA)– or vitronectin (Thermo Fisher Scientific)–coated well plates in feeder-free hPSC culture medium consisting of DMEM/F12 (Cellgro, Corning) supplemented with 1% penicillin/streptomycin (Thermo Fisher Scientific), 2 mM l-glutamine (Thermo Fisher Scientific), 1× nonessential amino acids (Thermo Fisher Scientific), 55 μM β-mercaptoethanol (Thermo Fisher Scientific), 20% KnockOut serum (Thermo Fisher Scientific), and rhbFGF (50 ng/ml ) (Thermo Fisher Scientific).

CM differentiation of hPSC lines
Both HES2 and HES3-NKX-2.5GFP cell lines were differentiated into CMs using a modified version of previously published cardiac differentiation protocols (21, 22). Briefly, hPSCs were grown to 80 to 90% confluence and dissociated into single cells and reaggregated to form EBs in StemPro-34 medium (Thermo Fisher Scientific) containing 1% penicillin/streptomycin (Thermo Fisher Scientific), 2 mM l-glutamine (Thermo Fisher Scientific), transferrin (150 mg/ml; Roche, Switzerland), ascorbic acid (50 mg/ml; Sigma-Aldrich), and monothioglycerol (50 mg/ml; Sigma-Aldrich), 10 mM Y-27632 (ROCK inhibitor, Tocris, UK), and rhBMP4 (1 ng/ml; R&D Systems, USA) for 18 hours on an orbital shaker. At day 1, the EBs were transferred to mesoderm induction media consisting of StemPro-34 medium with above supplements (-Y-27632) and rhBMP4, rhActivinA (R&D Systems), and rhbFGF (R&D Systems) at the optimal cardiac differentiations for each line given in fig. S6. At day 3, the EBs were harvested, washed with Iscove's modified Dulbecco's medium, and transferred to cardiac mesoderm specification medium consisting of StemPro-34 medium, 2 mM IWP2 (Wnt inhibitor, Tocris), and rhVEGF (10 ng/ml; R&D Systems). At day 6, the EBs were transferred to StemPro-34 with rhVEGF (5 ng/ml) for an additional 7 days under hypoxic conditions (5% O2). The cultures were further matured for another 8 to 10 days in StemPro-34 medium without additional cytokines under ambient oxygen conditions. At day 20, the hPSC-derived CMs were analyzed on the basis of the expression of cTNT via FCM. The EBs were cultured in ultralow attachment six-well dishes (Corning) throughout the differentiation, which routinely generated cultures with greater than 85% CMs, as determined by cTNT expression.

Definitive endoderm differentiation of hPSC lines
HES3-NKX-2.5GFP cell lines were differentiated into definitive endodermal cells using a commercially available kit (PSC Definitive Endoderm Induction Kit, A306260, Thermo Fisher Scientific). Briefly, hPSCs were seeded and grown to 10 to 20% confluence. At day 0, the medium was changed to PSC definitive endoderm induction medium A for 24 hours; after which, the medium was changed to PSC definitive endoderm induction medium B for 24 hours. The cells were then recovered for analysis and SCQC capture experiments. The differentiation routinely generates greater than 95% definitive endodermal cells based on the FCM analysis of SOX17 expression.

Generation of samples containing diluted or spiked hPSCs
Confluent hPSCs (50 to 70%) were dissociated by TrypLE (Thermo Fisher Scientific) for 3 min at RT. Dissociated cells were centrifuged, and the cell number was quantified by an automated cell counter (Countess II, Thermo Fisher Scientific) by taking the average of three to five individual counts. Low concentration solutions were achieved by serial dilution (maximal 9:1 ratio per dilution). Day 20 hPSC-derived EBs were dissociated to single cells by collagenase type 2 (300 U/mg; Worthington Biochemical Corp., USA) in Hanks’ buffer (Thermo Fisher Scientific) at 37°C for 90 min, followed by 3 min TrypLE treatment. Confluent hPSCs (50 to 70%) were dissociated by TrypLE for 3 min at RT, quantified by the cell counter, and serially diluted to achieve low concentrations of hPSCs. Populations of hPSCs and hPSC-derived CMs were combined together in the end to generate spiked samples containing 0.0005 to 5% HES2 cells in CMs. Total number of cells for each experiment is indicated in the figure captions.

Flow cytometry
For surface marker analyses, diluted or spiked samples were fixed by 4% methanol-free paraformaldehyde (PFA; Thermo Fisher Scientific) at RT for 10 min, blocked by 1% BSA (Sigma-Aldrich) in PBS (Wisent Bioproducts, Canada) on ice for 30 min, and stained by antibodies of SSEA-1, SSEA-4, TRA-1-60, TRA-1-81, CD324 (E-cadherin), CD326 (EpCAM), CD9, or CD90 (all from Miltenyi Biotec, Germany) for 10 min at 4°C in a flow buffer containing 1% BSA in PBS. For intracellular marker analyses, samples were fixed by 4% PFA at RT for 10 min, permeabilized by 0.5% Triton X-100 (Sigma-Aldrich) in PBS at RT for 10 min, blocked by 1% BSA in PBS on ice for 30 min, and stained by antibodies of SOX2, Oct3/4, Nanog (all from Miltenyi Biotec), or cTNT (BD Biosciences) for 30 min at RT in flow buffer. Detailed information regarding conjugations and dilutions is given in table S3. Stained samples were analyzed using the FACSCanto flow cytometer (BD Biosciences, USA) or the fluorescence-activated cell sorting (FACS) LSR Fortessa flow cytometer (BD Biosciences). Data were analyzed using FlowJo software (FlowJo LLC., USA). To characterize the LOD of FCM, three individual tubes were prepared for each concentration. The LOD was defined as means + 3 SD.

Droplet digital PCR
Total RNA was isolated from the spiked samples by using a single-cell RNA purification kit (51800, Norgen Biotek Corp., Canada) and used for ddPCR. The isolated RNA was used for cDNA synthesis using the First-Strand DNA Synthesis Kit (Invitrogen, USA), which contained random hexamer primers and Superscript III Reverse Transcriptase, according to the manufacturer’s protocol. The cDNA was submitted to the Centre for Applied Genomics (The Hospital for Sick Children, Toronto, Canada) for a standard ddPCR performed by a QX200 ddPCR system (Bio-Rad, USA). The TaqMan primers for target genes were purchased from Thermo Fisher Scientific: POU5F1 (OCT3/4, Hs00999634_gH), SOX2 (Hs04234836_s1), and CD326 (EpCAM, Hs00901885_m1). The TBP or B2M gene was used as the housekeeping control. The results were analyzed by the Centre for Applied Genomics using QuantaSoft Analysis Pro Software (Bio-Rad).

Characterization of magnetic labeling
Diluted samples were fixed by 4% PFA at RT for 10 min and labeled by anti–TRA-1-60 (dilution: 1:50; Miltenyi Biotec) in 1 ml of 1% BSA for 30 min at RT. Labeled samples were washed with 1% BSA in PBS twice and centrifuged at 2000 rpm for 4 min to form pellets. Pellets were then dehydrated with increasing concentrations of ethanol at 10-min intervals and embedded with Quetol-Spurr resin (Sigma-Aldrich) overnight. Samples were sliced to 70- to 80-nm-thick layers by an ultramicrotome (Ultracut RMC MT6000, Leica Microsystems, Germany) and deposited on electron microscopy grids (Ted Pella Inc.). Samples were observed under a transmission electron microscope (FEI Tecnai 20, Thermo Fisher Scientific) using 100-kV accelerating voltage.

Stem cell quantitative cytometry
Diluted or spiked samples were fixed by 4% PFA at RT for 10 min and labeled by anti–TRA-1-60 or anti-CD326 microbeads (dilution: 1:50; Miltenyi Biotec) in 1 ml of flow buffer for 30 min at RT. Labeled samples were loaded into the chips and profiled at flow rates ranging from 2 to 10 ml/hour. For the quantification of capture and depletion efficiency, captured cells were stained by DAPI and NucDead 488 (Thermo Fisher Scientific) for 10 min at the flow rate of 1 ml/hour. For the quantification of spiked hPSCs in hPSC-derived CMs, captured cells were permeabilized by 0.5% Triton X-100 in PBS at RT for 10 min at the flow rate of 1 ml/hour and stained by cocktails of antibodies [DAPI, NucDead 488, Oct3/4–PE (phycoerythrin), and Nanog–APC (allophycocyamin)] for 30 min at RT in a buffer containing 1% BSA and 0.1% Tween 20 (Bio-Rad, USA) at the flow rate of 400 μl/hour. Detailed information regarding antibody dilutions is given in table S3. After staining, the cells were washed with flow buffer for 10 min at the flow rate of 1 ml/hour. Washed chips were stored at 4°C and scanned within a week of profiling. To quantify the number of captured hPSCs, the chips were tile scanned using a Nikon Ti-E microscope with automated stages. The exposure time is 20 ms for DAPI, 10 ms for NucDead 488, 200 ms for Oct3/4-PE, and 400 ms for Nanog-APC. Scanned images were combined into a large image using Nikon NIS-Elements software (high content analysis version) and quantified using IMARIS software (Bitplane, Oxford Instrument, UK) via colocalization analysis. Cells (hPSCs) were defined as DAPI+, NucDead+, Oct3/4+, and Nanog+. To characterize the LOD of SCQC, three to five individual runs were performed for each concentration. The captured cell numbers were divided by 0.85 to normalize the effect of capture efficiency. The LOD was defined as means + 3 std.

Magnetic-activated cell sorting
For live cell separation, 1 million of HES2 hPSCs or derived CMs were labeled by anti–TRA-1-60 microbeads (dilution: 1:50) in 1 ml of flow buffer for 10 min at RT, as instructed by the manufacturer. Labeled samples were applied to MS columns (Miltenyi Biotec) and washed twice using the flow buffer. TRA-1-60–positive cells were recovered from the column by firmly pushing the plunger into the column twice. Recovered cells were centrifuged and immediately processed for cell counting using an automated cell counter. For stained cell separations, 1 million of HES2 PSCs or derived CMs were fixed, permeabilized, and stained by DAPI, Oct3/4-PE, and Nanog-APC. These cells were subsequently labeled with anti–TRA-1-60 microbeads (dilution: 1:50) in 1 ml of flow buffer for 10 min at RT. Labeled samples were then sorted using MS columns. Recovered cells were centrifuged and immediately processed for cell counting.

Teratoma formation and analysis
All animal experiments were carried out in accordance with the protocol approved by the University of Toronto Animal Care Committee. Male NOD/SCID/interleukin 2 receptor Gamma chain null (NSG) strains of mice at 6 to 8 weeks of age were purchased from the Jackson laboratory (USA) and maintained at the University of Toronto animal facility. Spiked sample with 1 × 10⁶ cells in 15 μl of Matrigel (Corning) was injected into the pericardium of testis. Ten weeks after injection, mice were euthanized, and the formation of teratomas was examined. Extracted teratomas were weighed and fixed in 10% formalin (Sigma-Aldrich). Formalin-fixed, paraffin-embedded teratomas were sectioned (5-μm thickness) and stained with hematoxylin and eosin. Histological examination was performed by a licensed veterinary pathologist blinded to the difference of samples to identify the germ layers in the teratomas.

In vitro colony-forming assay for spiked samples
Spiked samples were labeled by anti–TRA-1-60 microbeads in 1 ml of 1% BSA in PBS for 30 min at RT. Labeled samples were loaded into the chips and profiled at flow rates of 4 ml/hour. After profiling, magnets were removed from the chip. The negative groups were obtained from the syringe, and the positive groups were obtained by withdrawing cells in the chips with a new syringe. The profiled groups were centrifuged and resuspended in the hPSC culture medium for reculturing on vitronectin-coated well plates. At days 3, 6, 10, and 15 after profiling, the recultured cells were fixed by 4% PFA at RT for 10 min, permeabilized by 0.5% Triton X-100 in PBS at RT for 10 min, and stained by antibodies of DAPI, TRA-1-60-Vio488 (Miltenyi Biotec), Oct3/4-PE, and Nanog-APC for 60 min at RT in flow buffer. Detailed information regarding conjugations and dilutions is given in table S3. The plates were tile scanned using the Nikon Ti-E microscope. The exposure time is 20 ms for DAPI, 100 ms for TRA-1-60-Vio488, 200 ms for Oct3/4-PE, and 400 ms for Nanog-APC. hPSCs were defined as DAPI+, NucDead+, Oct3/4+, and Nanog+. Number of colonies (>4 hPSCs per colony) per well was quantified manually.

Isolation and characterization of rare hPSCs isolated from manufactured batches
In addition to the abovementioned EB-based protocol, a commercially available cardiac differentiation kit (A2921201, Thermo Fisher Scientific) was also used to generate batches of CMs from a monolayer. Briefly, HES2 and HES3-NKX-2.5GFP cells were maintained in vitronectin-coated well plates in Essential 8 medium (Thermo Fisher Scientific) for 2 days (days −2 to 0). The confluency of cells at day 0 is between 50 and 70%, as suggested by the manufacturer. Then, the medium was replaced with CM differentiation medium A and B at days 0 and 2, respectively. At day 4, the medium was changed to Cardiomyocyte Maintenance Medium (A2920801, Thermo Fisher Scientific) and changed every 2 days until day 16. Contracting CMs appeared at day 8, and the beating conditions of the CMs were monitored at days 8, 12, and 16 using the Nikon Ti-E microscope. The percentages of cTNT-positive cells at days 8, 12, and 16 were quantified by FCM using the protocol described in the “Flow cytometry” section. At days 4, 8, 12, and 16, monolayers of hPSC-derived CMs were dissociated by TrypLE for 4 min. At days 10 and 20, hPSC-derived CMs grown as EBs were dissociated to single cells by collagenase type 2 (300 U/ml) in Hanks’ buffer at 37°C (30 min for day 10 and 90 min for day 20), followed by 3-min TrypLE treatment. Dissociated cells were labeled by anti–TRA-1-60 microbeads and profiled using the protocol same to the spiked samples. The positive groups were recultured in StemFlexTM medium (A3349401, Thermo Fisher Scientific). At days 2, 6, and 10 after profiling, the positive cells were fixed, stained, and quantified using the same protocol used for the spiked samples. If rare hPSCs (DAPI+, TRA-1-60+, Oct3/4+, and Nanog+) were found at day 2, the same groups were passaged when it reached 80 to 90% confluency up to 14 days to allow rare hPSCs to proliferate. To examine the pluripotency of isolated rare hPSCs, proliferated hPSCs were differentiated into three germ lineages using a trilineage differentiation kit (130-115-660, Miltenyi Biotec), which typically takes 7 days. At day 7, the cells were fixed, permeabilized, and stained with DAPI, FOXA2, and SOX17 (for endoderm); DAPI, smooth muscle actin (SMA), and CD144 (for mesoderm); and DAPI, PAX6, and Nestin (for ectoderm). Detailed information regarding conjugations and dilutions is given in table S3. The stained plates were observed using the Nikon Ti-E microscope. The exposure time is 20 ms for DAPI, 100 ms for FOXA2-PE, 400 ms for SOX17-AF647, 20 ms for SMA-PE, 400 ms for CD144-AF647, 200 ms for PAX6-PE, and 600 ms for Nestin-AF647. To examine the naïveness of isolated rare hPSCs, total RNA was isolated from the proliferated hPSCs following the same protocol used for ddPCR. A comparative CT experiment was performed on an Applied Biosystems 7500 Real-Time PCR System (Thermo Fisher Scientific) using hPSC naïve-state qPCR array (07521, Stemcell Technologies, Canada). The assay was carried out using 5 μl of TaqMan Universal Mix, 4 μl of nuclease-free water, 1 μl of cDNA (10 ng/μl) for each sample in a 96-well plate. Cycling conditions for the qPCR were 95°C for 10 min, followed by 40 cycles of 95°C for 15 s and 60°C for 1 min. The post-PCR analysis was performed by an online tool provided by the manufacturer (https://stemcell.shinyapps.io/qpcr_tool/).

Acknowledgments

We would like to thank members of the Kelley and Keller laboratory, especially B. Green, X. Fan, A. Garcia, S. Ogawa, and S. Protze, for experimental advice and critical comments on the manuscript, A. Elefanty and E. Stanley (Monash University) for providing the HES3-NKX-2.5GFP reporter cell line, M. Ly, K. Patel, and H. Patel (Creative CADworks) for establishing the protocol for 3D printing, T. Paton (The Hospital for Sick Children) for assistance in ddPCR, M. Ganguly (University Health Network) for assistance in histology, and M. Larsen (Mbed Pathology) for assistance in pathology. Funding: Research reported in this publication was supported in part by the Canadian Institutes of Health Research (grant FDN-148415 to S.O.K. and grant FDN-159937 to G.M.K.). This research is part of the University of Toronto’s Medicine by Design initiative, which receives funding from the Canada First Research Excellence Fund. Z.W. was supported by a Connaught International Scholarship. Author contributions: Z.W., M.G., E.H.S., G.M.K., and S.O.K. conceived and designed the experiments. Z.W., M.G., R.M.M., S.U.A., M.L., L.Z., S.P., and Y.Z. performed the experiments and analyzed the data. All authors discussed the results and contributed to the preparation and editing of the manuscript. Competing interests: G.M.K is a founding investigator, equity holder, and a paid consultant for BlueRock Therapeutics LP and a paid consultant for VistaGen Therapeutics. Data and materials availability: All data needed to evaluate the conclusions in the paper are present in the paper and/or the Supplementary Materials. Additional data related to this paper may be requested from S.O.K.