
Research Article Summary
5 Minute Read
University of Cambridge researchers 3D print transparent inner-ear models to map cochlear implant insertion forces
Title
Impact of Scala Tympani Geometry on Insertion Forces during Implantation
Authors
Filip Hrncirik, Iwan V. Roberts, Chloe Swords, et al.
Journal
Biosensors, 2022, 12, 999
DOI Link
Summary
Researchers at the University of Cambridge 3D printed transparent, anatomically accurate models of the inner ear to systematically test how its shape affects the forces generated during cochlear implant insertion. The work, led by Hrncirik et al., found that insertion force depends almost entirely on how deep the implant travels around the spiral, not on the size or shape of the ear itself.

Summary Author
This page was prepared by CADworks3D to summarize and highlight a peer-reviewed research article authored by independent researchers utilizing the CADworks3D system.
Title
Impact of Scala Tympani Geometry on Insertion Forces during Implantation
Authors
Filip Hrncirik, Iwan V. Roberts, Chloe Swords, et al.
Journal
Biosensors, 2022, 12, 999
DOI Link
Key Results at a Glance
30 µm
Print Resolution
Scala tympani models were 3D printed at 30 µm resolution to capture fine anatomical detail
32.1 µm
Dimensional Accuracy
90% of the printed surface matched the original CAD file within this tolerance
3.00 ± 0.17 mN
Consistent Tip Force
The force needed to bend the implant tip stayed nearly identical across every model tested
10
Insertions Per Model
Each geometry was tested across 10 repeated insertions for reliable, reproducible data
Objective
Cochlear implants (CIs) are electrode arrays that restore hearing for people with severe to profound sensorineural hearing loss, a condition affecting a growing share of the more than 466 million people worldwide living with disabling hearing loss. A CI is inserted into the scala tympani (ST), a fluid-filled spiral chamber inside the cochlea, where it electrically stimulates the auditory nerve. The problem is that this insertion is not gentle. Mechanical trauma from the process can damage delicate structures like the basilar membrane, destroying a patient’s residual natural hearing in up to half of all implantations. Because that residual hearing enables valuable low-frequency acoustic cues and keeps the door open for future regenerative therapies, protecting it during surgery matters.
What makes insertion forces so hard to predict is that every patient’s cochlea is a slightly different shape. The ST varies in overall size, vertical trajectory, curvature, and cross-sectional area from person to person, and clinicians have long suspected that this anatomical variability drives some of the unpredictability seen in insertion forces. However, no prior study had systematically isolated each of these geometric parameters on its own. Earlier attempts either relied on artificial models that combined all three of the cochlea’s fluid chambers into a single simplified cavity rather than the true ST shape, or used scaled proxies that didn’t capture real anatomical detail.
This study set out to close that gap using a more direct approach: build individually adjustable, anatomically accurate 3D models of the ST, physically alter one geometric parameter at a time, and measure how each change affects the force experienced during a controlled, robotic CI insertion.
Methodology and Design
To create test models with real anatomical detail, the team started with a micro-CT scan of a cadaveric cochlea specimen, which was segmented in Stradview software and imported into a custom MATLAB script. This script mapped landmark points along the ST wall, mathematically characterized the spiral’s trajectory and cross-sections, and allowed each of these features to be manipulated independently before the modified geometry was rebuilt into a solid 3D mesh and exported as a printable file.
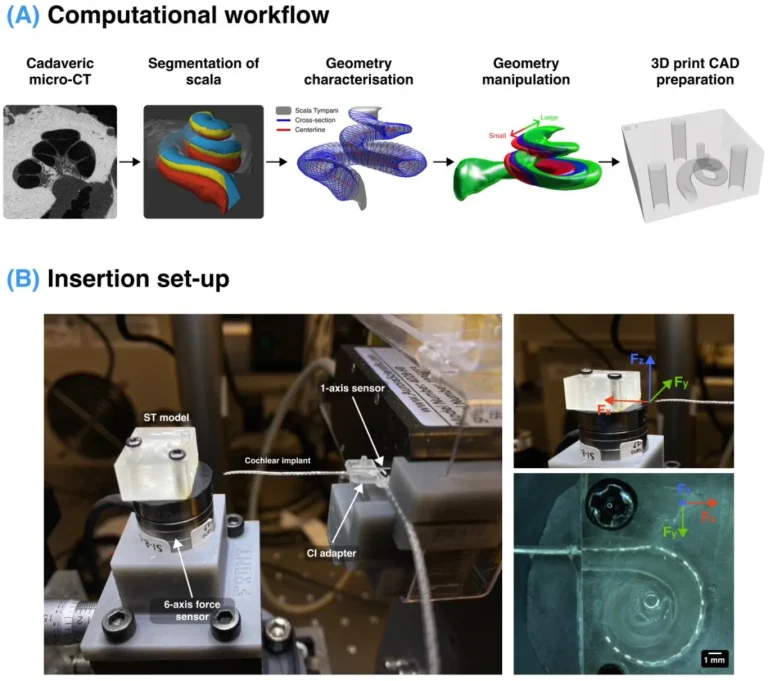
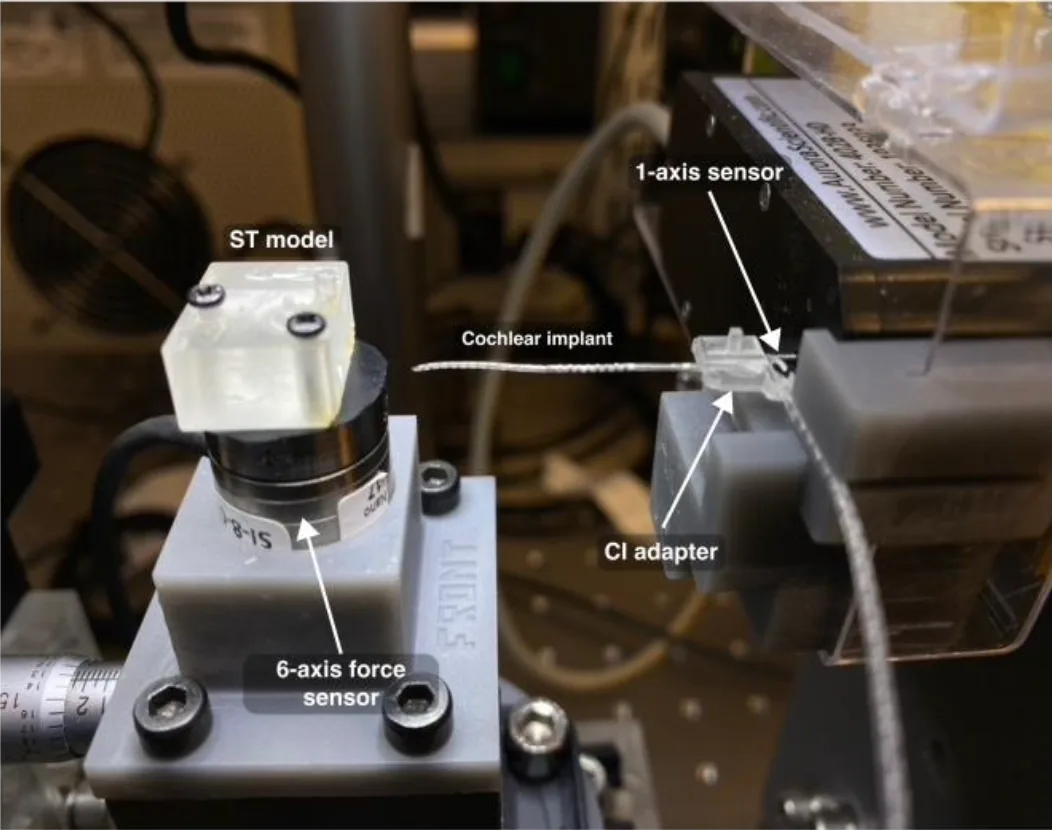
Figure 1. The 3D printing workflow, from anatomy to insertion testing. (a) A cadaveric cochlea was micro-CT scanned and segmented, then processed with a custom script that mapped its spiral shape and generated a 3D file ready for printing. (b) The resulting transparent, 3D-printed scala tympani model was mounted in a custom rig alongside a cochlear implant, with sensors capturing force in three directions during a controlled, motorized insertion. Source: Hrncirik et al. Impact of Scala Tympani Geometry on Insertion Forces during Implantation. Biosensors. 2022.
From this single base anatomy, the team generated four distinct sets of test models, each isolating one geometric variable at a time:
Size-Scaled Models
Vertical Trajectory Models
Curvature Models
Cross-Section Models
The size-scaled models were produced by uniformly scaling the original ST mesh to 110% (“large”) and 90% (“small”) of its original volume, testing whether a bigger or smaller cochlea changes the forces on the implant. The vertical trajectory models kept the ST’s spiral path the same but altered how much it rises and dips along its centerline, ranging from a completely flattened version to two “non-planar” versions with more pronounced undulations, mirroring natural variation reported in other cochlear imaging studies. Curvature was tested by tightening or loosening the mathematical spiral that defines the ST’s inner turn, producing “tight” and “loose” variants without changing the vertical trajectory. Finally, the cross-section models compared the ST’s naturally tapering canal, which narrows from base to apex, against a version with a single, uniform cross-sectional area running its full length. Each printed model was then mounted in a custom insertion rig and tested with a real cochlear implant electrode, driven in at a controlled 0.5 mm/s by a motorized stage, while two independent force sensors recorded the reaction forces on both the implant and the model itself.
Every model was printed at 30 µm resolution on a digital light processing (DLP) 3D printer using a clear, optically transparent microfluidics resin. After printing, models were rinsed in isopropyl alcohol and UV-cured across three 10-second cycles. To further sharpen optical clarity for tracking the implant during insertion, an acrylic coating was applied to the inner lumen, and a Pluronic solution was used to lower the surface’s friction coefficient before each test. Ten repeated insertions were carried out per geometry, split across two identical implant electrodes, to keep the resulting force data reliable and reproducible.
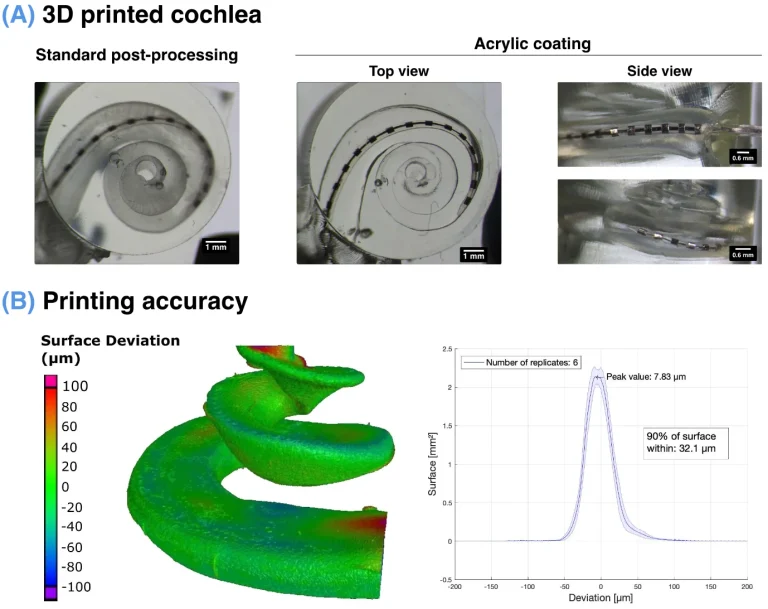
Figure 2. Validating the accuracy and clarity of the printed models. (a) The same printed model shown with standard post-processing (left) compared to an added acrylic coating (right), which visibly improves optical clarity for tracking implant position. (b) A surface comparison between the printed model and its original CAD file, shown as a 3D deviation map (left) and histogram (right), confirming that 90% of the print matched the design within 32.1 µm. Source: Hrncirik et al. Impact of Scala Tympani Geometry on Insertion Forces during Implantation. Biosensors. 2022.
Results
Printed at 30 µm resolution, the scala tympani models achieved genuine anatomical fidelity. A nominal-to-actual comparison against the original CAD file found that 90% of the printed surface matched the design within 32.1 µm, with the largest deviations occurring only at free-standing surfaces near the basal and apical ends, regions that never contact the implant during insertion. Combined with the acrylic coating step, this print accuracy also produced the clear, distortion-free models needed to visually track the implant’s position throughout each insertion.
Force measurements were highly consistent at the point of first contact between the implant and the ST wall: the tip force needed to bend the electrode averaged 3.00 ± 0.17 mN across every condition tested, giving the team a stable reference point for comparing the rest of each insertion.
The central finding, however, was about what didn’t change the forces. Raw insertion force did vary with geometry, larger models, for example, showed higher forces than smaller ones when measured against insertion distance. But once each measurement was recalculated relative to angular insertion depth (how far the implant had travelled around the spiral, in degrees, rather than in millimetres), the force profiles for every size, curvature, and cross-section variant overlapped almost completely, with no statistically significant differences between them. Only an exaggerated non-planar trajectory produced a small, statistically significant decrease in force, an effect judged unlikely to be clinically meaningful. These outcomes, generated from 10 repeated insertions per model, matched closely with a Capstan friction model, reinforcing that the angle of insertion, not the anatomy’s overall size or shape, is what determines the force experienced during implantation.
“The angular insertion depth, rather than the length of the CI inserted, should be the major consideration when evaluating the insertion force.”
— Hrncirik et al., Biosensors (2022)
Products Used In This Study

Questions on how our 3D printing system can work for your research? Connect with one of our specialists.
More Research Article Summaries
McGill University researchers build a 3D printed double-sided mold system to shape and merge brain organoids on a chip
University of Hawaiʻi researchers 3D print wearable "sweatainer" devices with true microscale internal channels
Want to read more article summaries?
We summarize the latest microfluidics and 3D printing research.
Curated from peer-reviewed publications featuring the CADworks3D system.