A rapidly prototyped lung-on-a-chip model using 3D-printed molds
Jesus Shrestha, Maliheh Ghadiri, Melane Shanmugavel, Sajad Razavi Bazaz, Steven Vasilescu, Lin Ding and Majid Ebrahimi Warkiani
Organ-on-a-chip is a microfluidic cell culture model that replicates key organ-specific microarchitecture and pathophysiology in vitro. The current methods to fabricate these devices rely on softlithography, which is usually tedious, laborious, and requires adroit users as well as cleanroom facilities. Recently, the use of 3D-printing technologies for the rapid fabrication of molds for polydimethylsiloxane (PDMS) casting is on the rise. However, most of the 3D-printed materials are unsuitable for PDMS casting. To address this issue, we have improved the existing techniques and introduced a modified protocol for the surface treatment of 3D-printed molds, making them ideal for repeated long-term PDMS casting. Using this protocol, we have fabricated a simple open well lungon-a-chip model to simulate the in vivo environment of airway at air-liquid interface under dynamic condition. To validate the functionality of the developed chip, Calu-3 cells were cultured in the chip and maintained at an airliquid interface. The model demonstrated that the cultured cells replicated the 3D culture-specific-morphology, maintained excellent barrier integrity, secreted mucus, and expressed cell surface functional P-glycoprotein; all indicative of a promising in vitro model for permeability assays, toxicological tests, and pulmonary drug delivery studies. To validate the suitability of this lung-on-a-chip in vitro model, the effects of cigarette smoke extract (CSE) on Interleukin-6 (IL-6) and Interleukin-8 (IL-8) release from cultured Calu-3 cells were examined. CSE treated cells showed significantly higher secretion of IL-6 and IL-8 over 24 h compared to the cells treated with both CSE and Budesonide, an anti-inflammatory drug. Moreover, our results illustrated that CSE reduced the expression of Ecadherin as an adherent junctional protein. In conclusion, the proposed protocol demonstrated an easy and lowcost fabrication technique which will allow a biologist with minimal technical skills to rapidly prototype molds for different/versatile organ-on-a-chip models
We kindly thank the researchers at University of Technology Sydney for this collaboration, and for sharing the results obtained with their system.

Introduction
The burden of respiratory diseases throughout the world is on the rise, with almost 4 million premature deaths from chronic respiratory diseases every year, indicating a serious health issue (Forum of International Respiratory Societies, 2017). Therefore, there is an urgent need to develop new respiratory drugs, which require developing better and physiologically relevant respiratory disease and drug testing models (Shrestha et al., 2020). The conventional methods used to reproduce the microenvironment, functions, and physiology of the human lung are two dimensional (2D) monolayer cell culture and transwell-based immersion cultures (Huh et al., 2011). However, these models do not accurately replicate in vivo three-dimensional (3D) cellular structure, cell-cell interactions, the air-exposed environment of the alveolar cells, and the physiological functions at the organ level.
The inability of existing cell culture models to accurately and reliably model respiratory disease has led to the emergence of microfluidic cell culture systems. Microfluidic systems precisely replicate the physiological conditions required for both basic research and drug development, enabling drug discoveries through systematic testing (Neuzil et al., 2012; Azadi et al., 2019). Several microfluidic organ-on-a-chip models replicating the 3D microarchitecture and mechanical and physiological features of different organ tissues have been developed (Esch et al., 2015). However, conventional softlithography techniques used to fabricate organ-on-a-chip devices impose severe limitations on time, geometric complexity, and cost, often requiring a separate cleanroom facilities and adroit users, as a result of which, impedes the pace of development and innovation in microfluidic applications. Therefore, a method for rapid fabricating microfluidic devices with little technical expertise would be ideal for scientists with little knowledge of microfabrication.
Recently, additive manufacturing has emerged as an alternative for the fabrication of microfluidic devices (Vaezi et al., 2013; Erkal et al., 2014; Bhattacharjee et al., 2016). With further developments in 3D-printing, there has been a significant increase in the utilization of 3D-printed part as molds to generate PDMS replicas. 3D-printing has superiority over other techniques of mold fabrication such as micro-milling or laser cutting, enabling higher resolution features and a control over height parameters (Guckenberger et al., 2015; Condina et al., 2019). Among all 3D printing methods, stereolithography apparatus (SLA) and digital light processing (DLP) offer great advantages and are therefore preferred for microfluidics and biomedical applications (Macdonald et al., 2017). This allows researchers to rapidly design and alter complex microstructures without expending large amounts of time or resources. In addition, 3D-printed molds are more adaptable as they can include multiple design features at different channel heights not possible using conventional photolithography techniques. However, most of the 3D-printed molds printed via SLA/DLP techniques are not immediately suitable for PDMS casting since residual monomers and oligomers on the surface of the 3D-printed parts impede PDMS polymerization. Several groups have proposed surface treatment methods for 3D-printed molds to make it suitable for casting PDMS, including ink or lubricant infused coatings, plasma treatment, salinization, and heat cycling (Waheed et al., 2017; Chan et al., 2015; Comina et al., 2014; Villegas et al., 2018). Reported protocols are time-consuming, labor-intensive, and lack reproducibility (Razavi Bazaz et al., 2019). Although many protocols contain similar basic parameters such as treatment time, curing temperature, and UV exposure, these parameters are subject to change according to feature dimensions. Some groups use the services provided by commercial 3D-printing companies to manufacture their molds (Park et al., 2019; Novak et al., 2018). However, these molds can be expensive and have waiting periods associated with manufacturing and delivery (Ellison et al., 2016). This type of arrangement does not allow rapid prototyping to be performed, where quick changes in design parameters are required. Curing temperature of PDMS on the 3D-printed molds is a vital step that requires careful optimization to prevent material strain and microstructure deformation. Therefore, it is crucial to develop an optimized surface treatment process for 3D-printed molds ensuring long-term cell viability in the organ-on-a-chip devices.
Herein, we present an enhanced protocol for surface treatment of 3Dprinted molds to fabricate a simple open access lung-on-a-chip design. The protocol presented here enables the quick fabrication of molds for long-term use without the development of any cracks or channel deterioration through carefully optimized steps and parameters. This treatment process allows high-resolution repetitive PDMS casting using 3Dprinted molds. The fabricated chip was further optimized by testing different membranes and ECM coatings for cell growth and extended viability. The chip allowed the lung epithelial cells to be cultured at an air-liquid interface under dynamic conditions; the transparency of PDMS enabled real-time cell visualization and chip monitoring (Fig. 1). Calu3 cells are known to highly express the tight junction proteins Occludin and E-cadherin, which makes it a suitable cell type for analyzing tightjunction formation and cell barrier functions (Kreft et al., 2015; Haghi et al., 2010). Mucus production, differentiation, and the expression of transport proteins are other features of Calu-3 cells, making them useful for modelling the airway epithelium. Different study groups have already shown the suitability of this cell line to use it as a respiratory in vitro model (Zhu et al., 2010; Foster et al., 2000; Florea et al., 2003). Thus, the Calu-3 cell line was chosen for our lung-on-a-chip device. Using Calu-3 cells, we demonstrate the versatility of our lung-on-a-chip model through the assessment of CSE effects and Budesonide treatment on the secretion of inflammatory markers and cellular expression of the junction protein E-cadherin. Furthermore, we provide a functional analysis of the epithelium cell layer generated. The flexibility of direct 3D-printing utilized in this study will aid the fabrication of novel organ-on-a-chip designs within a short time frame. The printing process we report here is versatile enough to be adapted for multiple organ-on-a-chip models beyond what is studied here.
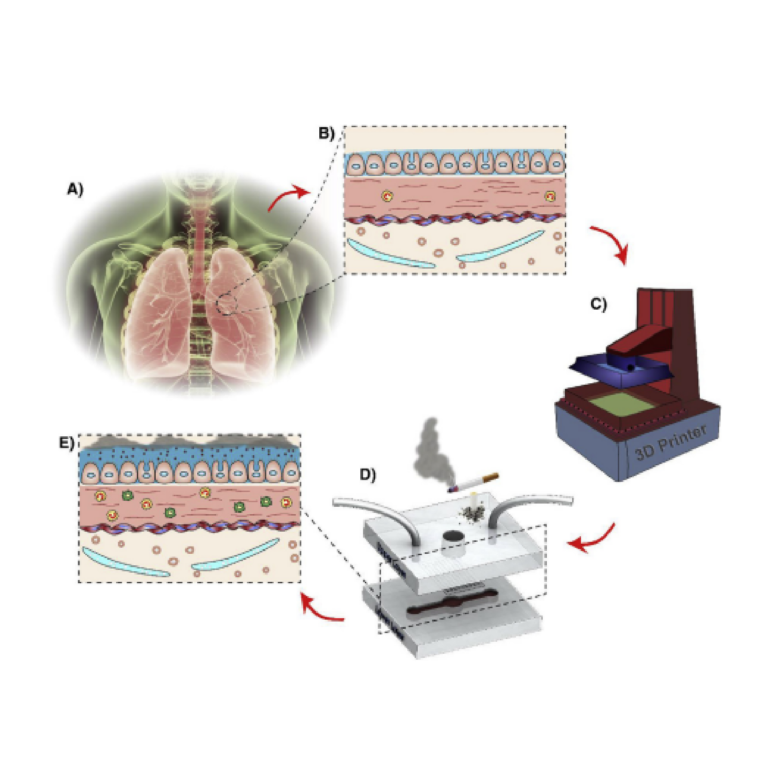
Fig. 1. Microfluidic model of human Lung-on-achip design and fabrication: A) A conceptual schematic of the experimental setup showing the human respiratory system B) A cross-section of human airway tissue. C) 3D printer was used to fabricate the open well design of the chip model with upper and lower layers to recapitulate human lung. D) The top layer contains a central open well for cell seeding, and an inlet and an outlet for media in the lower channel. The lower layer includes a channel for media flow. The porous PC membrane is carefully placed and aligned between the two layers, where the cells attach and grow. E) Once the cells were confluent, the effects of CSE on the cells were analyzed.
2. Materials and methods
2.1. Mold fabrication and surface treatment
The mold was fabricated using a digital light processing (DLP) 3Dprinter, (MiiCraft Ultra 50, MiiCraft, Hsinchu, Taiwan) with a printing area of 57 X 32 X 120 mm and XY resolution of 30 μm. The printer projects a 385–405 nm UV wavelength through the resin (BV-007) on the resin bath. The design process began with Computer-Aided Design (CAD) modelling of the required geometries in SolidWorks (2016), after which designs were exported in an STL file format to the Miicraft printer software (MiiCraft 125, Version 4.01, MiiCraft Inc). To enable highresolution printing of mold features, the print options were carefully tailored to each design. Smaller design features required a slice thickness of 10 μm and a curing time of 1 s per slice, where features were less fine, slice thicknesses of 30 and 50 μm were used. Considering the size of the printed molds, a base layer was used to ensure the part adhered to the picker for the duration of the print. The curing time for the base layer was set to 24 s. A buffer layer was used to facilitate the transition from the base layer into the printed part.
To prevent the PDMS from sticking to the 3D-printed mold, surface treatment of the resin mold is mandatory. We have optimized the surface treatment method proposed before (Waheed et al., 2017) to shorten the overall duration, making it suitable for channels with smaller dimensions and with the ability of repeated casting without affecting the mold structures. First, the 3D-printed mold was washed with isopropanol (IPA) followed by high-pressure air drying after the print. After that, the post-curing of the mold is required for 3 min (steps of 10 s). To make sure that uncured monomers and oligomers on the surface of the mold are eliminated, the prepared mold was then soaked inside 100% ethanol for 2 h. The surface of the mold must be prepared for the step of an easy detachment of the PDMS; hence, Oxygen plasma treatment (Basic Plasma cleaner PDC-002, Harrick Plasma) was carried out for 2 min. In the end, surface of the mold was silanized using trichloro (1H, 1H, 2H, 2H-perfluoro-octyl) silane (Sigma-Aldrich, Australia) in a desiccator under vacuum for 1.5 h. The workflow for mold design and fabrication is illustrated in Fig. 2.
2.2. Flow simulation and diffusion in the channels
To characterize how the microchannel impacts fluid flow and its effect on the membrane, a 2D model of the proposed design was analyzed using Comsol multiphysics 5.3a, a commercial CFD package (Bazaz et al., 2018). To study the effects of fluid flow on the membrane, a coupled equation in free and porous media flow is mandatory. The flow in the microchannel is described using continuity and Navier-Stokes equations.
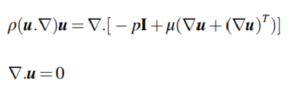
Here, u represents the vector of fluid velocity, ρ denotes fluid density, μ refers to dynamic viscosity, and p is the pressure. In this study, Brinkman equations are used for the momentum transport over the membrane.

where εp is porosity, κ is permeability, Qbr denotes mass source or mass sink, and F equivalents to the external forces. Using an oversimplified Darcy's law results in the neglection of the viscous effect which arises from the fluid media. As an alternative, the Brinkman equation was employed to solve the fluid within the porous media. A hydrophilic Isopore polycarbonate membrane (Sigma-Aldrich, Australia) is used in this study. The pore size of the membrane (dpÞ is 0.4 μm while the porosity ðεp Þ is 15%, and membrane thickness is 10 μm. The membrane permeability can be calculated via a packed bed model, and its value
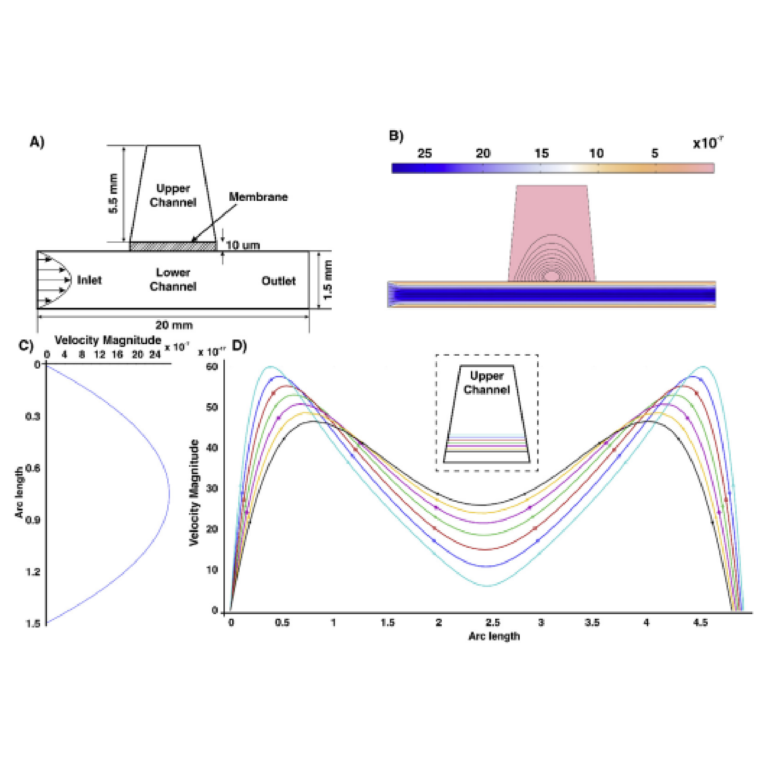
Fig. 2. Protocol for the surface treatment of the 3D printed resin molds: A) CAD design of the desired mold using Solidworks. B) The finalized designs are printed using the 3D printer. C). The mold is then washed with IPA, followed by UV curing. D) and E). The mold is then dipped in ethanol before plasma treating. F) and G) Before casting PDMS, the mold is silanized. Once the PDMS is cured, it is carefully cut out from the molds to form two slabs. The PDMS slabs are then cleaned with alternative IPA and Ethanol washing before being plasma treated, aligned, and bonded carefully to make a complete lung-on-a-chip adjusted to 4.98e-18 m2 and 4.98e-19 m2 in the absence and presence of the cells on the membrane, respectively. The physics-controlled mesh was used as the domain grid in this study. The normal inflow velocity was applied at the inlet, while zero static pressure was considered at the outlet.
2.3. Device fabrication
Following surface treatment of the resin mold, a mixture of PDMS base and curing agent (ratio of 10:1) was prepared (Sylgard 184 from Dow Corning, MI, USA) (Fig. 2). The mixture was then degassed in a desiccator for 20 min and poured into the treated molds. The PDMS was left to cure in the hot air oven for 4–5 h at 45 C. The PDMS layer was gently lifted off from the mold, trimmed to desired shapes, and holes are punched for inlets and outlets. The PDMS layers were thoroughly cleaned with IPA and ethanol, at least three times, followed by air drying between each wash. Polycarbonate membrane was cut into a square shape, large enough to cover the central circular well and carefully placed on the lower PDMS layer. The contact surface of both the upper and lower PDMS layers was plasma treated for 1 min and aligned precisely to ensure perfect bonding. The bonded chip was then kept in the oven again for 4 h at 45 C to bond, followed by testing for leakage using food dyes.
2.4. Cell culture
Human airway epithelial cell line, Calu-3 from American Type Cell Culture Collection (ATCC, Rockville, IN, USA) were cultured in Dulbecco's Modified Eagle's medium: F-12 (DMEM: F12) supplemented with 10% fetal bovine serum (FBS), 1% L-glutamine, 1% penicillin ( Gibco, Life Technologies, Australia) and 1% non-essential amino acids (SigmaAldrich, Australia). The chip was sterilized by flushing 70% ethanol through the channels, followed by hot air drying in the oven. It was then exposed to UV light in a biosafety cabinet for 30 min before the extracellular matrix (ECM) coating. Once the membrane was coated with ECM, the chip was kept in a humidified incubator at 37 C with 5% CO2 for 2 h before seeding cells. Residual ECM coating in the channels was removed by passing fresh culture media. After seeding with cells, the chips were maintained in 37 C and 5% CO2. The media in both the upper and lower channels were replaced daily until the cells were confluent (day 5). Once the confluency was achieved, the media from the upper channel was aspirated to allow cells to grow in the air-liquid interface. The lower channel was then attached to a syringe pump (Fusion 200, Chemyx Inc.) with a flow rate of 30 μl/h to maintain a dynamic condition with fresh media flow.
2.5. Cell adhesion to the membrane and ECM coating
Different combinations of membranes and ECM coatings were tested to guarantee optimal cell growth and the formation of a confluent monolayer. The different membranes tested were Isopore membrane Polycarbonate filter (PC) (Merck, Australia), Nuclepore track-etch PC membrane (Whatman, Australia), Polyester (PE) from transwell cell culture inserts (Corning Incorporated, Australia), and Millipore from Millicell culture plate inserts (Sigma- Aldrich, Australia), all with 0.4 μm pore size. The membranes were first tested without any ECM coating. Calu-3 cells were seeded at 8000 cells/mm2 and incubated at 37 C, 5% CO2. Media in both channels were changed every day. The cells were stained with a working concentration of 1 μg/ml of Hoechst 33342 (Abcam, Australia) and incubated for 15 min on day 5. After washing with phosphate-buffered saline (PBS), it was observed under the microscope to identify the most suitable membrane with the highest level of cellular attachment. To further enhance the cell attachment, selected membrane was coated with different ECMs: (i) 5 μg/ml of Fibronectin (Corning, 356008), (ii) 3 μg/μl of Collagen-I (Col-I) (Corning, 354236), (iii) 6 μg/μl of Matrigel (Corning, 354234) and (iv) a mixture of 6 μg/μl Matrigel and 3 μg/μl Col-I. This was followed by incubation for 2 h at 37 C, 5% CO2, and washing with PBS (Sigma- Aldrich, Australia) to get rid of excess ECM. Cells were seeded and incubated. The media from both channels was changed the next day. The cells were then stained with Hoechst 33342 on day 5 and observed with Olympus Ix73 Inverted Microscope for cellular attachment to determine the optimal ECM coating for Calu-3 cell culture.
2.6. Viability and functionality testing of the device
After the selection of the membrane and ECM coating, the following experiments were conducted in the final chip design.
2.6.1. Cell viability and proliferation
Live/dead cell double staining kit (Sigma-Aldrich, Australia) was used to distinguish viable cells from non-viable cells. The assay solution of the stain was prepared by adding 10 μl of Calcein-AM (Solution A) and 5 μl of Propidium Iodide (Solution B) in 5 ml of PBS. The cells were washed with PBS before adding the assay solution. 30 μl of the assay solution was added to the cell layer in the upper channel and incubated at 37 C for 15 min. Olympus Ix73 Inverted Microscope was used to simultaneously observe live and dead cells.
2.6.2. Mucus staining
The mucus production from the Calu-3 cells in the chip was characterized on day of 3, 5, 7, 9, and 11 of culture by staining the glycoprotein in the mucus using Alcian blue (1%. (w/v) in 3% (v/v) acetic acid/water at pH 2.5) (Sigma- Aldrich, Australia). The monolayer of the cells was washed twice with PBS. After fixing the cells with 4% (v/v) Paraformaldehyde for 20 min, PBS wash was repeated. Finally, 50 μl of Alcian blue stain was added. The chips were incubated for 15 min and washed multiple times with PBS until the rinsate was clear. Images were obtained using an Olympus Ix73 Inverted microscope. Depending on the ratio of red, green, and blue (RGB) from the microscopic images of mucus staining, data were analyzed to generate a semi-quantitative estimate of mucus concentration (Haghi et al., 2010). The mean RGB values were obtained with Image J (v1.52p, NIH) with Color Profile (Dimiter Prodanov; Leiden University Medical Centre, Leiden, Netherlands). The mean RGBB was divided by the total sum of RGB values for each image (RGBR þ RGBG þ RGBB) to calculate the ratio of blue (RGBB ratio). The mean RGBB of eight images was used to quantify the secretion of mucus by the Calu-3 cells for days 3, 5, 7, 9 and 11.
2.6.3. Paracellular permeability of sodium fluorescein (Flu-Na)
The barrier integrity of the cells grown on the membrane was assessed by using Flu-Na (MW 0.367 kDa, Sigma-Aldrich, Australia) on day 7. The cell layer in the upper channel was washed with warm PBS (37 C) after removing the media from both the channels. The lower channel was filled with prewarmed PBS, and the cells were incubated at 37 C for 2 h. The upper channel was filled with 50 μl of flu-Na solution (2.5 mg/ml), while PBS was flushed through the lower channel at 0.5 μl/min for both blank devices and seeded chips. Samples were collected from the lower channel every 30 min for a total of 120 min. The fluorescence of flu-Na present in each sample was measured in Corning full black clear bottomed 96-well plates using a fluorescence plate reader (Infinite 200 PRO; TECAN), using excitation and emission wavelengths of 485 and 520 nm, respectively.
2.6.4. Flow cytometry detection of cell surface P-Glycoprotein
On day 7, the Calu-3 cells were harvested from the membrane of the chip by trypsinization (TrypLE Express; Gibco). After washing twice with PBS, the cells were labelled using 20 μl of FITC-anti P-gp (clone17F9, BD Pharmingen, USA). It was then incubated in the dark at room temperature for 30 min. The cells were washed twice again with PBS before resuspending them in 200 μl of PBS, spiked with (1 μg/ml) propidium iodide (PI) (Sigma- Aldrich, Australia). Samples were analyzed by flow cytometry (FCM) using the CytoFLEX LX (Beckman Coulter, Life Sciences, USA) and CytExpert Software.
2.7. Preparation of CSE and treatment of the cells
Cigarette smoke extract (CSE) was prepared by a method modified from a publication (Laurent et al., 1983). One Marlboro Red cigarette (Philip Morris, Victoria, Australia) was bubbled through 25 ml of DMEM in a T-75 flask at a constant rate, which was considered as 100% concentration CSE. The collected CSE was filtered and diluted to the required CSE concentrations in the media. Prepared CSE was immediately used and diluted within 30 min. To stimulate Calu-3 cells with a non-toxic concentration of CSE, first cytotoxicity assay was performed. Briefly, Calu-3 cells were cultured in 96-well plates were stimulated with serial dilutions of CSE from 0.0675% to 100%. The cytotoxic concentration of CSE on Calu3 cells over 48 h was tested using MTS assay kit (Promega, CellTiter 96® AQueous One Solution Cell Proliferation Assay- Australia). Then, cells grown on the chip were stimulated with appropriate concentration of CSE (the concentration below IC50 (Inhibitory concentration at 50%). The experiment was categorized into four groups of chips, and the cells were grown as mentioned previously for 7 days. One group was first treated with 100 nM Budesonide for 24 h from the lower chamber and then treated with CSE from the top (Bud-CSE). The second group was treated with CSE and 100 nM Budesonide at the same time (CSE-Bud). The third group was only treated with CSE and the fourth group was the control (no treatment). The lower channel was connected to a syringe pump and media was collected in a tube for 24 h; this media was used to measure IL-6 and IL-8 with ELISA technique. The media collected from the chips were stored at -80 C.
2.8. Enzyme-linked immunosorbent assay (ELISA) for IL-6 and IL-8
The media collected from the chips were stored at 80 C until performing the experiment. After thawing them, the levels of secreted IL-6 and IL-8 were analyzed according to the manufacturer's instructions, using commercial human IL-6 and IL-8 ELISA kits (BD Pharmingen, San Diego, CA, USA). The absorbance was read at 450 nm/570 nm using plate reader (Infinite 200 PRO; TECAN).
2.9. Immunofluorescence staining
To visualize the effects of CSE and Budesonide treatment on the tight junctions, the Calu-3 cells were assessed by imaging of immunolabelled stains of tight junction protein, E-cadherin. Images were taken using a Nikon A1 confocal microscopy (Japan). All immunostaining steps were conducted at room temperature. The cells were fixed with 4% volume/ volume (v/v) paraformaldehyde (Sigma- Aldrich, Australia) in PBS after washing three times with PBS. It was then incubated for 15 min and washed with PBS twice. This was followed by permeabilization of the cell membranes with 0.1% (v/v) Triton X 100 (Sigma- Aldrich, Australia) for 10 min and blocking with 1% (w/v) bovine serum albumin (BSA) (SigmaAldrich, Australia) in PBS for 1 h. After further washing with PBS, cells incubated with 50 mM ammonium acetate in PBS for 10 min. Then cells were washed with PBS and incubated at 37 C with CD324 (E-Cadherin) monoclonal antibody (10 μg/ml in PBS) (Invitrogen) for 1 h. Rewashing with PBS was done before adding AlexaFlour 594 goat anti-mouse IgG1 (10 μg/mL in PBS) (Invitrogen, Australia) to incubate for 1 h. After washing with PBS, the cells were counterstained with 1 μg/mL 40 , 6-diamidino-2- phenylindole (DAPI) in water for 10 min before washing with PBS. The membrane was carefully cut from the open well of the chip and mounted on a microscopic glass slide and covered by a coverslip. Care was taken to prevent curling and tearing of the membrane, and the slides were stored at 4 C. The slides were viewed the next day using the Nikon A1 Confocal Laser Microscope with NIS-Elements C Software.
2.10. Statistical analysis
Data were analyzed using IBM SPSS Statistics 25 software (USA). The ANOVA one-way analysis was used to determine significance (P < 0.05). All results are expressed as the mean standard deviation (SD) of at least three independent determinants.
3. Results and discussion
3.1. Fabrication of the mold and the device
Lung-on-a-chip models typically have closed system designs with straight channels (Huh et al, 2010, 2012, 2013; Jain et al., 2018; Benam et al., 2016). Although this allows uniform flow, manipulating cell suspensions and micro-volumes of fluids through microchannel is challenging. Functional tests such as immunostaining, mucus secretion, and permeability assays become difficult to perform within a closed design chip. The open well design of our device allows easy access to the membrane for uniform coating, cell seeding, fluid manipulation, and sample collection. Moreover, the open access design allows the cells to be directly exposed to the CSE, drugs or nanoparticles, making transport or migration studies more controllable. Multiple open well chambers can be interconnected to each other to conduct independent as well as parallel studies. This was first suggested by Blume et al. who developed a similar open well design compatible with commercially available Transwells to be interconnected. (Blume et al., 2015). However, this is a complicated process compounded by the number of components comprising their chip design. We have effectively simplified the lung-on-a-chip model to facilitate the on chip cell culture with the potential for multichip interconnections. The simple maintenance and usability of our chip will allow a person familiar with conventional cell culture methods to conduct their experiments in a more relevant microenvironment, even with minimum microfluidic knowledge.
The open well lung-on-a-chip model presented here consisted of an upper PDMS layer with a large circular well, an inlet, and an outlet on either side (Fig. 3A). The lower layer comprised of a central chamber connecting to two straight channels from either side. The thin, porous PC membrane separated the two PDMS layers. The 3D-printed mold consisted of raised channels to imprint the PDMS surface. Surface treatment of the mold before casting PDMS is vital for PDMS casting (Chan et al., 2015). This treatment cures the surface areas of the mold left uncured from the 3D-printing process. To achieve this, the mold must be free of any debris, residual monomers or oligomers. The process of silanization provides a hydrophobic fluorinated monolayer on the 3D-printed mold that prevents the sticking of the PDMS to the resin mold. This methodology allows easy peeling off the PDMS from the mold. Curing PDMS at 45 C for 4–5 h was found to yield the best surface finish for the 3D-printed resin molds. PDMS incubation with the mold at higher temperatures induced the formation of surface fractures within the mold, negatively impacting the surface finish of the PDMS piece, resulting in leaking of the bonded device. Hence, it can be reasoned that the temperature has a significant influence on the molds.
This approach of fabricating and treating the 3D-printed resin molds is a simple, cost-effective, and time-efficient method for producing 3D microfluidic lung-on-a-chip models compared to the conventional softlithography techniques using silicon wafers. The 3D-printing of the molds, surface treatment, and chip fabrication can be completed within a day. This helps to avoid the typically lengthy processing and delivery time of the commercially manufactured molds. This time reduction is a result of optimized fabrication steps minimizing the risk of human error. Thus, the approach presented here enables researchers to rapidly prototype multiple designs of different geometries within a short period. The molds created can be used repeatedly without concern over the reproducibility between chips. However, despite these advantages, 3D-printing has certain limitations regarding the resolution of printable features and quality of the surface. For instance, ink-jet type 3D-printing is an option available for 3D-printing molds to cast PDMS and fabricate chips (Kamei et al., 2015). Nevetheless, ink-jet 3D-printing can result in increased surface roughness and may cause altercations in channel profiles.
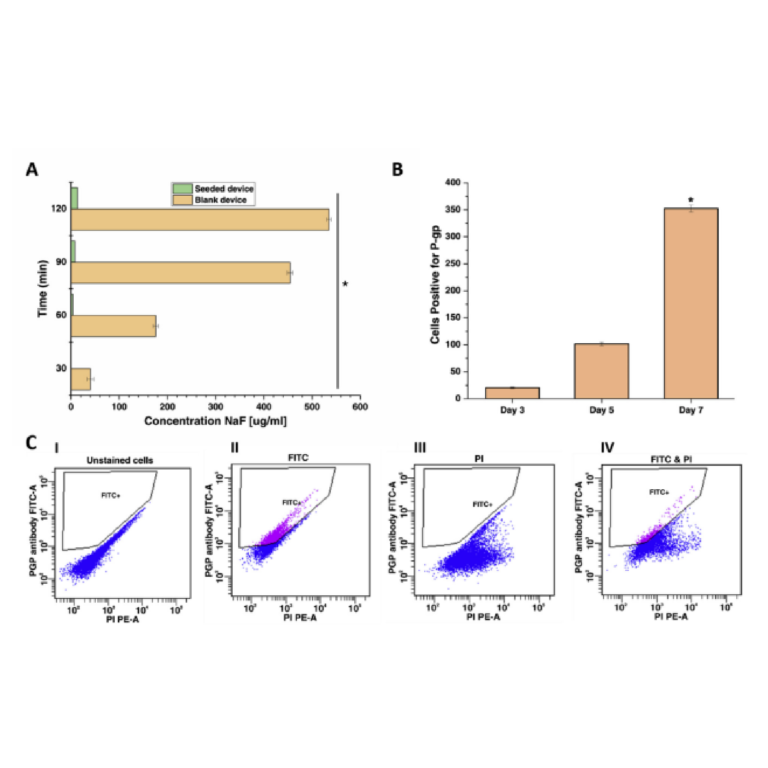
Fig. 3. Simulations of fluid flow in the lung-on-a-chip model: A) Geometry and boundary conditions used for computational modelling. B) Velocity profile along the length of the microchannel. It is evident that the velocity distribution across the upper channel is small enough to not negatively impact attached cells. C) Velocity distribution along the length of the channel. It is shown that the velocity profile in lower channel has a parabolic profile. D) Velocity profile at the upper channel. The order of velocity is small enough so that cells are not influenced by shear rate.
3.2. Fluid behaviour and diffusion simulation in the microchannel
To better quantify the fluid behaviour within the lung-on-a-chip device, the flow velocity was simulated, as shown in Fig. 3B. The numerical results reveal that the flow exists at a steady-state condition, and the relative velocity is higher in the lower channel compared to the upper channel. Streamlines in the lower channel run along the length of the channel from inlet to outlet and shows that the velocity profile in the lower channel is parabolic (Fig. 3B) while, in the upper channel, fluid is driven from the lower channel across the porous membrane before exiting from the membrane. These results indicate that fluid can traverse the membrane, passing between the upper and lower channels continuously. Thus, the velocity distribution along the length of membrane is calculated and illustrated in Fig. 3D. According to the value of velocity in the upper channel, the effect of media flow on the cells growing on the membrane is negligible. This allows the secreted molecules from the cells cultured on the membrane to remain undisturbed in the interstitial fluid since the flow of media is limited to the lower surface of the cell layer (Nalayanda et al., 2009; Walker et al., 2004). This was further validated by mucus staining performed over several days.
3.3. Cell adhesion to the membrane and ECM coating
To determine the optimal membrane and ECM coating combination to support the adhesion and growth of the Calu-3 cells in the device, several types of membranes and ECMs were tested. We evaluated the results based on the cell adhesion and area coverage by cells. Chips were seeded with 8000 cells/mm2 which ensured a viable cell population covering a large area. Based on these findings, 8000 cells/mm2 seeding density was used for all subsequent experiments in this study. On the fifth day of incubation, the chip was observed for cell attachment; to help confirm cellular attachment, the cells were stained with Hoechst (Fig. 4AI). The PE membrane consistently showed large empty areas with minimal cellular attachment. In comparison the Millipore membrane provided greater cell attachment, but the membrane with the most consistent cell attachment was PC (Merck, Australia). Therefore, for further experiments on ECM coatings, PC (Merck, Australia) membranes were used.
To identify which ECM coating achieved the highest level of cellular attachment, cell viability and the formation of a monolayer, multiple PC membranes were coated with Fibronectin, Collagen-I, Matrigel, and a mixture of Matrigel and Collagen-I. A mix of 6 μg/μl Matrigel and 3 μg/μl Col-I was selected based on findings suggested by Humayun et al. (2018). Seeded membranes were then incubated and washed with PBS to remove all detached and dead cells. The cells were then stained with Hoechst to compare the results of different ECM coatings on day 5 (Fig. 4AII). Fibronectin coated chips had few attached cells, with the majority of the membrane left unoccupied. The membrane coated with Collagen-I had comparatively more cells attached but still had large sections void of any cells. Matrigel coating had a significantly larger proportion of cells attached to the membrane with few empty spots. The coating with the highest cell coverage was the mixture of Matrigel and Col-I, similar to the findings of Humayun M., et al. Fig. 4AII illustrates the distribution of area coverage by cells in each membrane and ECM scenario tested. The most confluent monolayer can be observed in the combination of collagen and Matrigel on a PC membrane.
3.4. Testing the functionality of the lung-on-a-chip model
3.4.1. Live and dead staining
To confirm the cell viability, cells grown in the chips for 3, 5, and 7 days were stained with live and dead staining kit. The aim was to note the day for the cells to get fully confluent with minimal dead cells in the chip. The chip was then connected to a syringe pump to provide a constant stream of media in the lower channel, while the cells were cultured at the air interface in the upper channel by removing the media. The number of live cells increased gradually from day 3 and were confluent by day 5. On day 5, the media on the upper channel was removed to create an airliquid interface. The cells were viable and growing well on day 7 i.e., after 48 h at the air-liquid interface (Fig. 4C). Thus, we decided to perform further characterization of the cell layer lung-on-a-chip model
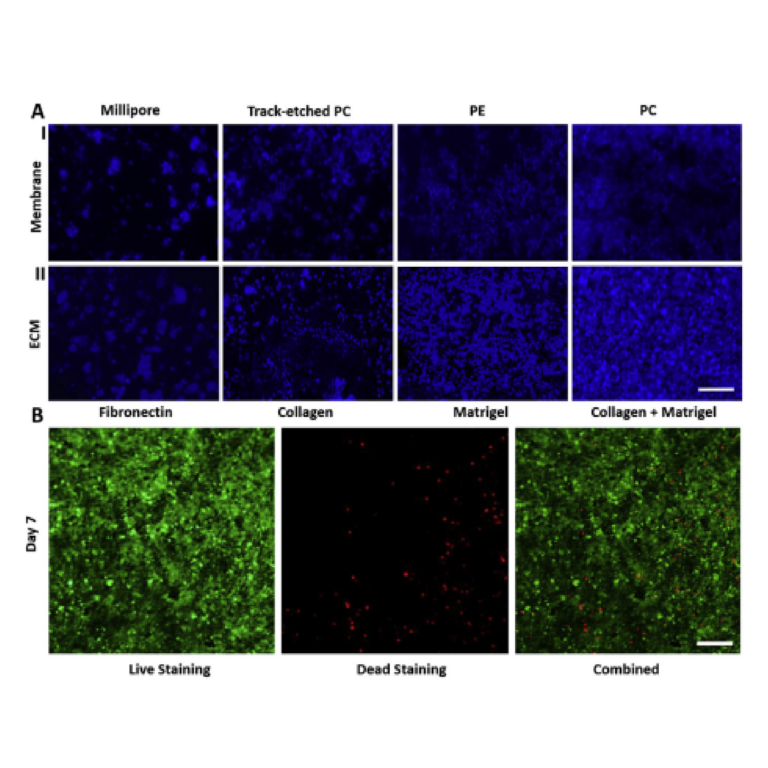
Fig. 4. Calu-3 adhesion in the chip: A) I. Cell adhesion to the membrane A-II Selection of coating ECM on the PC membrane: Once the PC membrane was identified as the suitable membrane, different ECM coating was used to identify the optimal ECM for cell attachment and proliferation. All cells were stained with Hoechst stain. (Scale: 100 μm) B) Cell viability: Live and dead staining of the cells in the chip on day 7 (Scale: 100 μm).
on day 7. With optimized seeding density and proper ECM coating, the results showed that the chip was able to grow and maintain a viable cell population up to 2 weeks.
3.4.2. Mucus secretion
Airway mucus is an extracellular gel, which traps inspired toxins and carries them out of the lung through ciliary beating and coughing, making the lungs highly defensive to environmental harm (Fahy and Dickey, 2010; Knowles and Boucher, 2002). Calu-3 cells contain submucosal glands, which are a source of airway surface liquids such as mucus, making it an optimal cell line for assessing cellular functionality (Knowles and Boucher, 2002). Alcian blue staining enabled the detection of secreted mucus in Calu-3 cells (Haghi et al., 2010; Inglis et al., 1998). A film of mucus was seen on the surface of the Calu-3 cell layer after day 3 (Fig. 5A). The representative microscope images shown indicate an increase in mucus secretion over the 7 days of growth, as the blue staining became progressively darker, covering more areas of the membrane. The amount of mucus produced over several days, measured as an RGBB ratio (Fig. 5B), increased with time.
Here, mucus secretion is used as an indicator of a differentiated cell
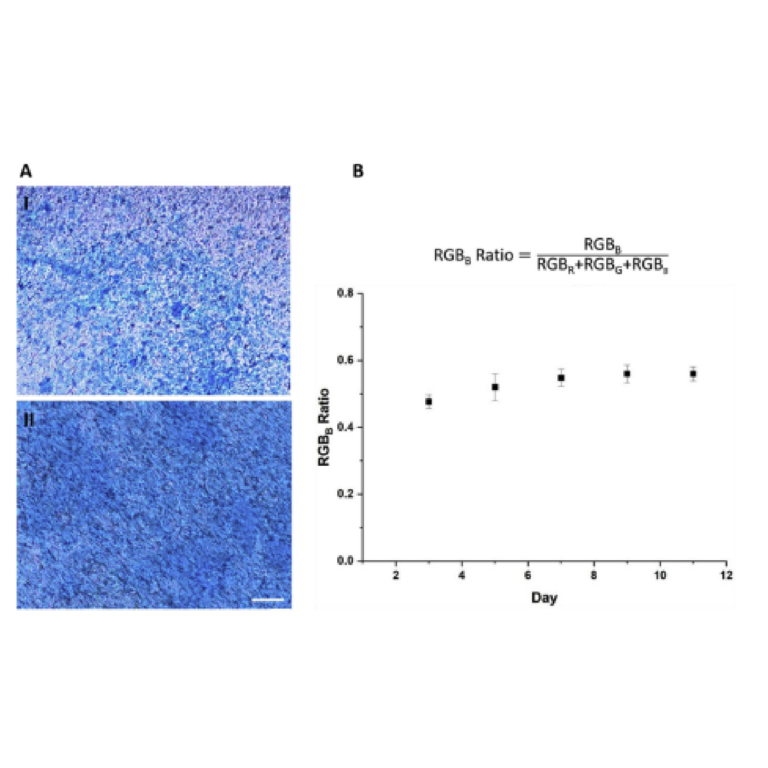
Fig. 5. Mucus staining of Calu-3 in the chip A) Microscopic images of mucus staining of Calu-3 cells at I. Day 3 and II. Day 7 B) A plot of RGBB ratio across several days of Calu-3 grown in the chip (Mean SD, n ¼ 8) (Scale: 100 μm). J. Shrestha et al. Organs-on-a-Chip 1 (2019) 100001 7
layer to goblet cells (mucus-producing cells) and, therefore, by extension, the physiological functionality of cells (Haghi et al., 2010). The RGBB value is an indirect measure of mucus production and shows variations in mucosal secretion, which enables a comparison of mucus secretion across several days. Since the secretion increased with time, it can be concluded that the cell layer grown in the chip represented physiological functionality.
3.4.3. Sodium fluorescein permeation
The permeability of the cell monolayer was tested by studying the permeation of sodium fluorescein (flu-Na) across the cell monolayer. There was a significant decrease in the permeability values in the cultured devices as compared to the blank devices (Fig. 6A). The significant difference in flu-Na concentration indicates a barrier formation by the cell junctions in the monolayer of cells growing on the membrane. This ability of the model to culture cells at an air-liquid interface and develop a tight barrier against flu-Na permeation, is another physiological function of respiratory epithelial cells.
3.4.4. Cell surface P-gp expression
Transport proteins are integral transmembrane proteins involved in the pharmacokinetics of many drugs (Haghi et al., 2010). They play a crucial role in the absorption of the drugs, its distribution, and elimination of waste metabolites; as such they are vital in maintaining the pharmacological barrier integrity throughout the body. P-gp is a plasma membrane glycoprotein, magnesium (Mg2þ)-dependent ATPase, and is a predominant drug transporter protein (Bebawy et al., 2001). P-gp is physiologically expressed on the surface of respiratory epithelial cells (Madlova et al., 2009). Commonly used drugs for treating respiratory diseases have shown interaction with P-gp, making it relevant for respiratory drug transport studies (Forbes and Ehrhardt, 2005). The P-gp expression of the cultured Calu-3 cells in the chips was analyzed using flow cytometry by direct immunolabelling. In comparison with the isotype control, chip grown cells displayed P-gp expression, which increased gradually over time (Fig. 6B). Nevertheless, this result further validates the functionality of Calu-3 cells in our lung-on-a-chip model and favours the suitability of the model to be used for in vitro pulmonary drug transport studies.
3.5. Effects of CSE on IL-6 and IL-8 production from cultured Calu-3 cells
Cigarette smoke contains over 4000 individual chemicals, which are noxious and carcinogenic (Burns, 1991). These chemicals, once deposited on the surface of the airways, absorb across the alveolar-capillary membrane to be circulated into the blood. The inflammatory response contributes to the structural and functional changes in the lung, leading to their destruction and subsequently the development of lung diseases. Cigarette smokers are associated with altered levels of inflammatory cytokines secretion in their bronchoalveolar lavage (BAL) (Maestrelli et al., 2001; Mikuniya et al., 1999). IL-8 is a potent chemoattractant for neutrophils and eosinophils; released by phagocytes and various tissue cells when exposed to inflammatory stimuli (Baggiolini and Clark-Lewis, 1992). IL-6 is a pro-inflammatory cytokine secreted by epithelial cells and macrophages in the airways (Mikuniya et al., 1999). Several studies have reported increased levels of IL-6 and IL- 8 in the BAL and induced sputum obtained from smokers (Mikuniya et al., 1999; Mio et al., 1997). Budesonide, a glucocorticoid, has been successfully used in asthma and inflammatory disorders like COPD (Lung and Institute, 2002; Keatings et al., 1997). The cytotoxicity assay showed that 10% CSE was not toxic to the cells (Supplementary Materials). Thus, 10% CSE was used for the
Fig. 6. A) Flu-Na permeation: Transport of flu-Na from apical to basolateral in blank and seeded chips on day 7 of culture (n ¼ 3, * ¼ p < 0.01) B) Comparison of the P-gp expression in Calu-3 cells cultured in the chip on different days: The expression of P-gp increased with days. C) Flow cytometry results of measuring P-gp expression by Calu-3 cells on day 7: I. Control group with no staining; II. Control group stained with FITC-anti P-gp III. Control group stained with PI IV. Samples stained with both FITC-anti P-gp and PI.
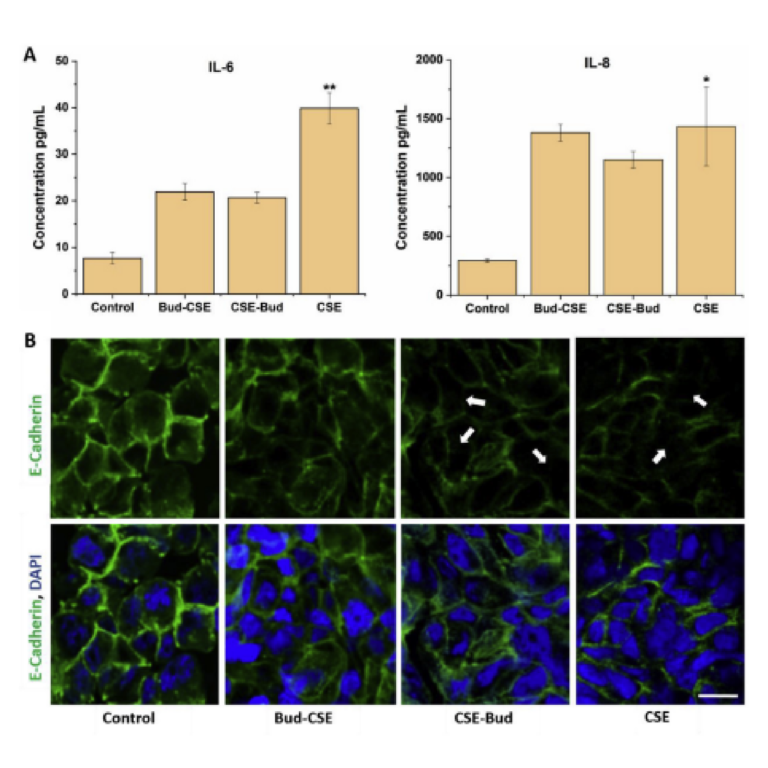
experiments. Significantly increased secretion of IL-6 (p < 0.01) and IL-8 (p < 0.05) was observed with CSE treatment. The cells treated with 10% CSE only released significantly higher amounts of IL-6 (p < 0.01) and IL-8 (p < 0.05) over 24 h compared to cells treated with both CSE and Budesonide (Fig. 7A). The CSE-Bud and Bud-CSE group had lower amounts of IL-6 and IL-8 secretion, indicative of the anti-inflammatory effects of Budesonide (Keatings et al., 1997; Confalonieri et al., 1998). The increased secretion of IL-6 and IL-8 on exposure to CSE are in substantial agreement with previous studies (Mikuniya et al., 1999; Mio et al., 1997; Wang et al., 2000). The capability of our model to successfully replicate the effects of CSE and Budesonide makes it a suitable in vitro model for toxicological and inflammatory studies.
3.6. Effects of CSE on cellular expression of E-cadherin
The junctional complexes, tight junctions, and adherens junctions maintain the epithelial cell integrity (Jang et al., 2002). The tight junctions are located apically and form a barrier controlling paracellular permeability of ions and solutes, while the adherens junctions hold the cells together through calcium-dependent adhesion molecules (Tsukita et al., 2001; Zihni et al., 2016). E-cadherin, an adherent junction protein, is observed in the cell membrane or cell-cell junctions. It is required for proper localization of essential tight junctional proteins like claudin-1 and 4, and ZO-1, into junctions to maintain a correct and intact tight junction formation (Tunggal et al., 2005). The loss of this cell transmembrane protein destabilizes the epithelial cell integrity, leading to dissociation between neighbouring cells and reduced its polarity (Willis and Borok, 2007). Cigarette smoke exposure has been associated with the disruption of the airway epithelium barrier integrity and increased permeability (Rusznak et al., 2000). Also, the disruption of the intercellular junctional integrity in the absence of tight junction proteins when exposed to CSE has been previously noted (Schamberger et al., 2014). To confirm the effects of CSE treatment on the expression of the surface protein, E-cadherin, the Calu-3 cells were stained with monoclonal antibodies against E-cadherin and observed with a confocal laser scanning microscope. Single confocal slices are shown in Fig. 7 B illustrate the differentiated tight junction and nucleus stained regions. The cells grown in absence of CSE maintained their morphology and strongly expressed E-cadherin protein. However, treatment with 10% CSE for 24 h, showed reduced expression of the epithelial marker. Similarly, the cells treated with both CSE and Budesonide also had a slightly reduced expression of the E-cadherin. The results agree with earlier findings of the effects of CSE on the barrier integrity and E-cadherin expression in cultured airway epithelial cells (Schamberger et al., 2014; Oldenburger et al., 2014; Xi et al., 2000). This re-affirms the validity of our microfluidic lung-on-a-chip model as a functional platform to conduct pulmonary studies.
4. Conclusion
A simple fabrication technique of lung-on-a-chip devices using surfacetreated 3D-printed molds has been proposed in this paper. The fabrication technique allows the chip to be fabricated in less than a day, and the molds can be used for repeated PDMS casting. Thus, the technique is simple, robust, and cost-effective. Validation of our design was conducted by investigating the effects of CSE on the production of inflammatory markers, IL-6, and IL-8, along with effects on cellular expression of adherent junction protein, E-cadherin. CSE augmented the release of IL-6 and IL-8 from the epithelial cells cultured within a lung-on-a-chip model. The budesonide treatment helped to reduce the effects of CSE on the release of both IL-6 and IL-8. Moreover, our results show that the CSE disrupted the airway epithelial barrier by affecting the junctional proteins. This result is supportive of the findings of numerous studies suggesting that cigarette smoke is the precursor of inflammatory response and