Tracking the dynamics of circulating tumour cell phenotypes using nanoparticle-mediated magnetic ranking
Mahla Poudineh, Peter M. Aldridge, Sharif Ahmed, Brenda J. Green, Leyla Kermanshah, Vivian Nguyen, Carmen Tu, Reza M. Mohamadi, Robert K. Nam, Aaron Hansen, Srikala S. Sridhar, Antonio Finelli, Neil E. Fleshner, Anthony M. Joshua5, Edward H. Sargent and Shana O. Kelley
Profiling the heterogeneous phenotypes of rare circulating tumour cells (CTCs) in whole blood is critical to unravelling the complex and dynamic properties of these potential clinical markers. This task is challenging because these cells are present at parts per billion levels among normal blood cells. Here we report a new nanoparticle-enabled method for CTC characterization, called magnetic ranking cytometry, which profiles CTCs on the basis of their surface expression phenotype. We achieve this using a microfluidic chip that successfully processes whole blood samples. The approach classifies CTCs with single-cell resolution in accordance with their expression of phenotypic surface markers, which is read out using magnetic nanoparticles. We deploy this new technique to reveal the dynamic phenotypes of CTCs in unprocessed blood from mice as a function of tumour growth and aggressiveness. We also test magnetic ranking cytometry using blood samples collected from cancer patients.
We kindly thank the researchers at University of Toronto for this collaboration, and for sharing the results obtained with their system.

The metastasis of cancerous tumours relies on the release of circulating cells that migrate to distant sites and form secondary tumours1,2. The factors that determine the invasiveness of these circulating tumour cells (CTCs) remain poorly defined, and it is not yet possible to distinguish CTCs that have high versus low metastatic potential. Studying CTCs that are directly collected from unprocessed blood samples is a challenge given their rarity (parts per billion) in the bloodstream3,4. Moreover, these cells are highly heterogeneous: multiple cell phenotypes can exist within a given tumour, and their properties evolve dynamically once they leave a tumour and enter the bloodstream1.
Fluorescence-activated cell sorting (FACS) is a powerful presentday method to characterize and sort heterogeneous cell subpopulations. Unfortunately, FACS does not possess the sensitivity required to enable the routine characterization of CTCs at the levels at which they are present in the bloodstream, and is therefore not broadly applicable to the analysis of rare cells in clinical specimens. Microfluidics-based approaches have provided a new avenue to study CTCs5–17; however, existing techniques are generally limited to the capture and enumeration of CTCs and do not report on the phenotypic properties of CTCs.
New methods are urgently needed to characterize and sort CTCs according to their detailed phenotypic profiles so that the properties of invasive versus noninvasive cells can be identified. High levels of sensitivity and high resolution are required to generate profiles that will provide biological and clinical insights. We recently reported a method that allowed us to sort CTC subpopulations coarsely according to their phenotypic properties18. The resolution that was achieved, however, enabled discrimination among surface expression levels only when very large differences were at play. We hypothesized that much greater resolution would be required to accurately profile the phenotypes of CTCs to connect their molecular-level properties with invasiveness.
Here, we report a novel approach that exploits nanoparticlemediated cell sorting, and relies on a unique chip architecture that achieves excellent control over an applied magnetic field along a channel. In this way, this new system accomplishes high-resolution phenotypic ranking of CTCs. We term the new approach, which is based on the longitudinal profile of magnetic field gradients, magnetic ranking cytometry (MagRC). MagRC generates a phenotypic profile of CTCs using information collected at the single-cell level. We show that it allows sorting of CTCs into one hundred different capture zones. We find that MagRC has a very high level of sensitivity and is able to profile CTCs accurately even when they are present at low levels (10 cells per ml) in unprocessed blood. The strategy allows the dynamic properties of CTCs to be tracked as a function of tumour growth and aggressiveness. Using blood samples both from xenografted mice and from human cancer patients, we show that the increased resolving power of MagRC provides distinct new information that is not accessible using existing methods.
Overview of MagRC
The MagRC approach leverages immunomagnetic separation19 for profiling CTCs as a function of their surface marker expression. A whole blood sample is incubated with antibody-functionalizedmagnetic nanoparticles that bind specifically to a correspondingsurface marker, and microengineered structures inside the deviceenable the rare cell profiling capability of MagRC. X-shaped struc-tures within the microfluidic channel generate regions with slowflow and favourable capture dynamics18, a requirement for thecapture of cells that are tagged with magnetic nanoparticles;whereas highly discretized sorting of subpopulations is achievedvia the introduction of differently sized nickel micromagnets20.Thelocal magnetic force is engineered to vary systematically withinthe device via the footprint of the micromagnets (Fig. 1b,c). Themicromagnets are positioned concentrically within the X-shapedmicrostructures, creating regions with low flow and high magneticfield gradients that are ideal for capturing CTCs with even low levelsof magnetic loading (Fig. 1a). This device, coupled with immunostain-ing of captured cells, is intended to generate high-resolution profiles ofcells captured from whole blood (Fig. 1d).
A quantitative physical model of the device (see SupplementaryFigs 1–4) was developed to explore how cells exhibiting variedexpression levels would generate different MagRC profiles that man-ifested their distinct phenotypes. A capture volume was defined as aregion in which the magnitudes of the magnetic and drag forces arecomparable. As a result, those cells that pass through a capture zonewill be deflected and captured. For a cell covered with an abundanceof bound magnetic nanoparticles, the capture zones generated byeven the smallest micromagnets are sufficient to ensure completecapture in the earliest zones of the MagRC Chip (Fig. 1c, top).Cells with low surface marker expression are deflected only if theyare close to edges of the micromagnets, where the magnetic forceacting on the nanoparticles is highest (Fig. 1c, bottom). As eachmicromagnet is positioned concentrically with an X-structure, theregions in the MagRC chip that exhibit the highest magneticforces and field gradients also correspond to the regions thatexhibit the slowest flows. This has the benefit of creating localizedregions with favourable capture dynamics (low drag and highmagnetic forces), while also contributing to the high-resolutionsorting capability of the chip.
For each cell in each zone, the probability of that cell encounteringa capture region was calculated and reported as the captureparameter. Because the nickel micromagnets generate amplified mag-netic fields near the bottom of the microfluidic channel, the captureparameter of a given cell within the chip depends strongly on its ver-tical position. Additionally, the extended length of the chip relative toits height leads to long residence times and the potential for cells tosettle towards the bottom of the chip. The vertical dependence ofthe capture parameter for cells having different levels of magneticloading is illustrated in Fig. 2a. Thousands of model cells were simu-lated, each having a randomly assigned initial height ranging from 5to 45 µm at the inlet of the microfluidic chip. The overall modellingresults presented in Fig. 2b show the predicted capture locations forthree types of cells with high, medium and low levels of magneticloading. (See Supplementary Information for a detailed explanationof the parametric model).
Resolution, sensitivity and versatility of the MagRC approach
In a first suite of experiments, we used four cell lines with knownlevels of expression of the epithelial cell adhesion molecule(EpCAM) to challenge the capture and sorting capabilities of theMagRC chip. EpCAM is a surface marker that is commonly usedto target CTCs. It is known that CTCs lose EpCAM when theyundergo the epithelial to mesenchymal transition (EMT) duringcancer progression21,22, and therefore tracking this marker shouldallow EMT to be monitored. Four different target cell lines—MCF-7, SKBR3 (breast adenocarcinoma cells), PC-3 (humanprostate cancer cell line) and MDA-MB-231 (a breast cancer cellline with mesenchymal characteristics that mimics triple negativebreast cancer cells)—were incubated with 50 nm nanoparticlescoated with anti-EpCAM in buffered solution. After capture, anuclear stain was introduced into the chip to identify capturedcells, and the capture efficiency was assessed by counting the cap-tured cells using fluorescent microscopy. Experiments for each cellline were repeated three times. Figure 3a shows the fluorescentmicroscope images of an SKBR3 cell captured at the edge of anickel micromagnet (where the magnetic field and field gradientsare at a maximum).
The four different cell lines tested exhibited markedly differentdistributions within the device (Fig. 3b and Supplementary Fig. 5).High recoveries of the cells injected into the device are achieved(MCF-7 95 ± 5%, SKBR3 93 ± 4%, PC-3 91 ± 6%, MDA-MB-23194 ± 5%; Fig. 3c), indicating that this approach has a high level ofsensitivity. MCF-7 cells, which have the highest level of EpCAMexpression, were found primarily in the earlier zones where themicromagnets are the smallest. However, PC-3 and MDA-MB-231 cells (which had the lowest level of EpCAM expression) wereonly captured after they encountered the large micromagnetscloser to the outlet of the chip. The relative levels of EpCAMexpression of the cell lines were con firmed via flow cytometry(FCM, inset to Fig. 3b). T-test analysis was used to assess the statisti-cal significance of the MagRC profiles obtained from different celllines (Supplementary Tables 1–3). The calculated P values(<0.0001) confirm the statistical significance of the uniqueness ofthe MagRC profiles and that the resolution of this technique ishigh. On the basis of these results we can conclude that theMagRC chip is able to sort cells according to the expression levelof a targeted surface marker. Moreover, it efficiently captures cellsthat exhibit even low levels of a target surface marker, and can beapplied widely to target surface markers for which a correspondingantibody is available.
This MagRC approach is amenable to the use of a wide range ofsurface antigens as the basis for profiling. We profiled the SKBR3cell line using three different surface markers that are oftenexpressed in epithelial cancer cells: human epidermal growthfactor receptor 2 (HER2)/neu, EpCAM and N-cadherin (Fig. 3d).The inset in Fig. 3d shows the level of these three surface markersin SKBR3 cells measured by FCM. HER2 is known to be highly over-expressed in this cell line, and experiments with magnetic nanopar-ticles coated with anti-HER2 led to cell capture within the veryearliest zones of the chip. In contrast, capture with anti-N-cadherincoated nanoparticles showed most cells being captured in the laterzones of the chip. EpCAM levels are intermediate for these cells, afact also reflected in the MagRC profiles.
The data presented indicate that MagRC produces profiles thatare comparable to those reported by FCM. FCM is a powerful androbust approach useful in analysing protein expression and hetero-geneity in living cells. It is limited in its sensitivity, however, andrequires cell numbers of 104or higher for accurate results23.Asshown here, MagRC reports on protein expression with a similarresolution, but using much smaller collections of cells. It is alsonoteworthy that the MagRC approach is a gentle analysis methodthat allows high recoveries of viable cells (Fig. 3e). 92% of capturedcells can be recovered, and 98% of the recovered cells are viable(Supplementary Fig. 7).
We then proceeded to challenge the system using unprocessedwhole blood samples, and found that MagRC retains its sensitivityand pr ofiling capability . When whole blood samples (1 ml) containingbetw een 10 and 40 cells were profiled using EpC AM as a targetmark er, reproducible pr ofiles w ere obtained (Fig. 4). We comparedthe performance of the MagRC appr oa ch with the CTC gold s tandardFDA-clear ed CellSear ch as say (Fig. 4b). Spiked blood sa mples contain-ing 100 SKBR3, PC-3 and MDA-MB-231 cells per millilitr e w er eprepared and analysed using both the MagRC chip and CellSearch.High re co veries of the spik ed samples injected into the MagRC chip
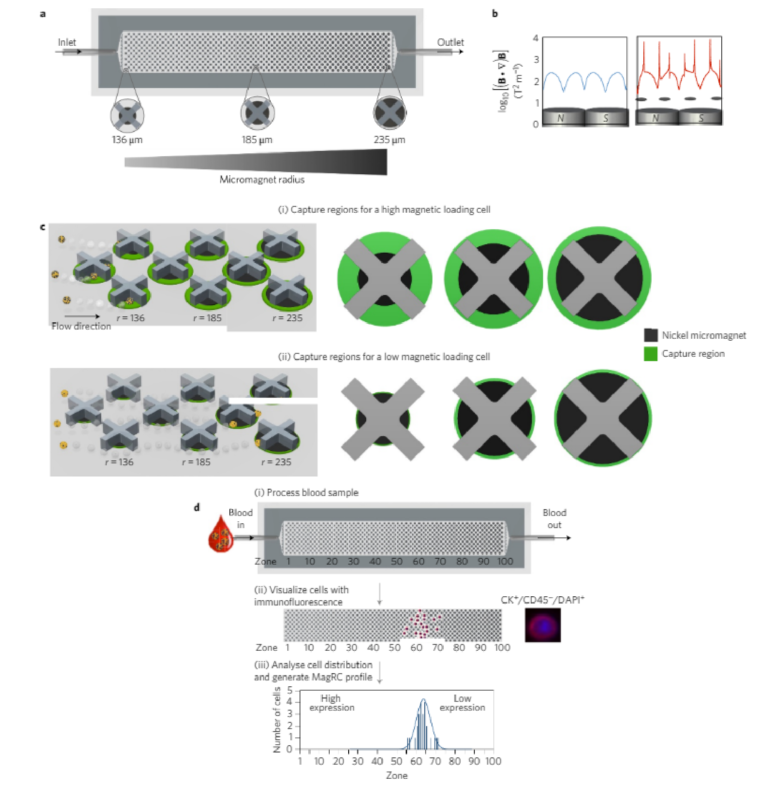
Figure 1 | The MagRC approach to profiling rare cells. a, The microfluidic chip used for MagRC contains 100 distinct zones with varied magnetic capture zones. An array of X-shaped structures generates regions of locally low velocity and circular nickel micromagnets patterned within the channel enhance the externally applied magnetic field. Increasing the size of the micromagnets along the channel increases their region of influence, where high magnetic field gradients lead to efficient CTC capture; these regions are termed capture zones. b, Comparison of the field gradient in the absence (left) and the presence (right) of Ni micromagnets. The micromagnets generate enhanced field gradients inside the microfluidic channel. The field gradient was measured at the channel height of 5 µm. B denotes magnetic field in the equation. c, Schematic representation of the capture zones in a condensed MagRC chip. The green annuli represent capture regions where cells with varied nanoparticle loadings are predicted to be captured efficiently. CTCs with high levels of surface marker expression experience larger effective capture regions as they flow through the chip. Cells with high levels of surface marker expression (and thus high magnetic loading) are captured in the earliest zones where the micromagnets are small (i, top), while for low expression cells, the larger micromagnets encountered later in the chip are required to generate a sufficiently large capture region (ii, bottom). r denotes the micromagnet radius. d, Overview of the MagRC approach. (i) Whole, unprocessed blood is introduced into the microfluidic chip. Once the sample has been processed, the chip is washed with buffer. (ii) Immunostaining is then used to identify CTCs and their distribution within the chip. (iii) The number of cells in each zone is then tabulated and used to generate a profile that reflects the levels of protein expression for the cells
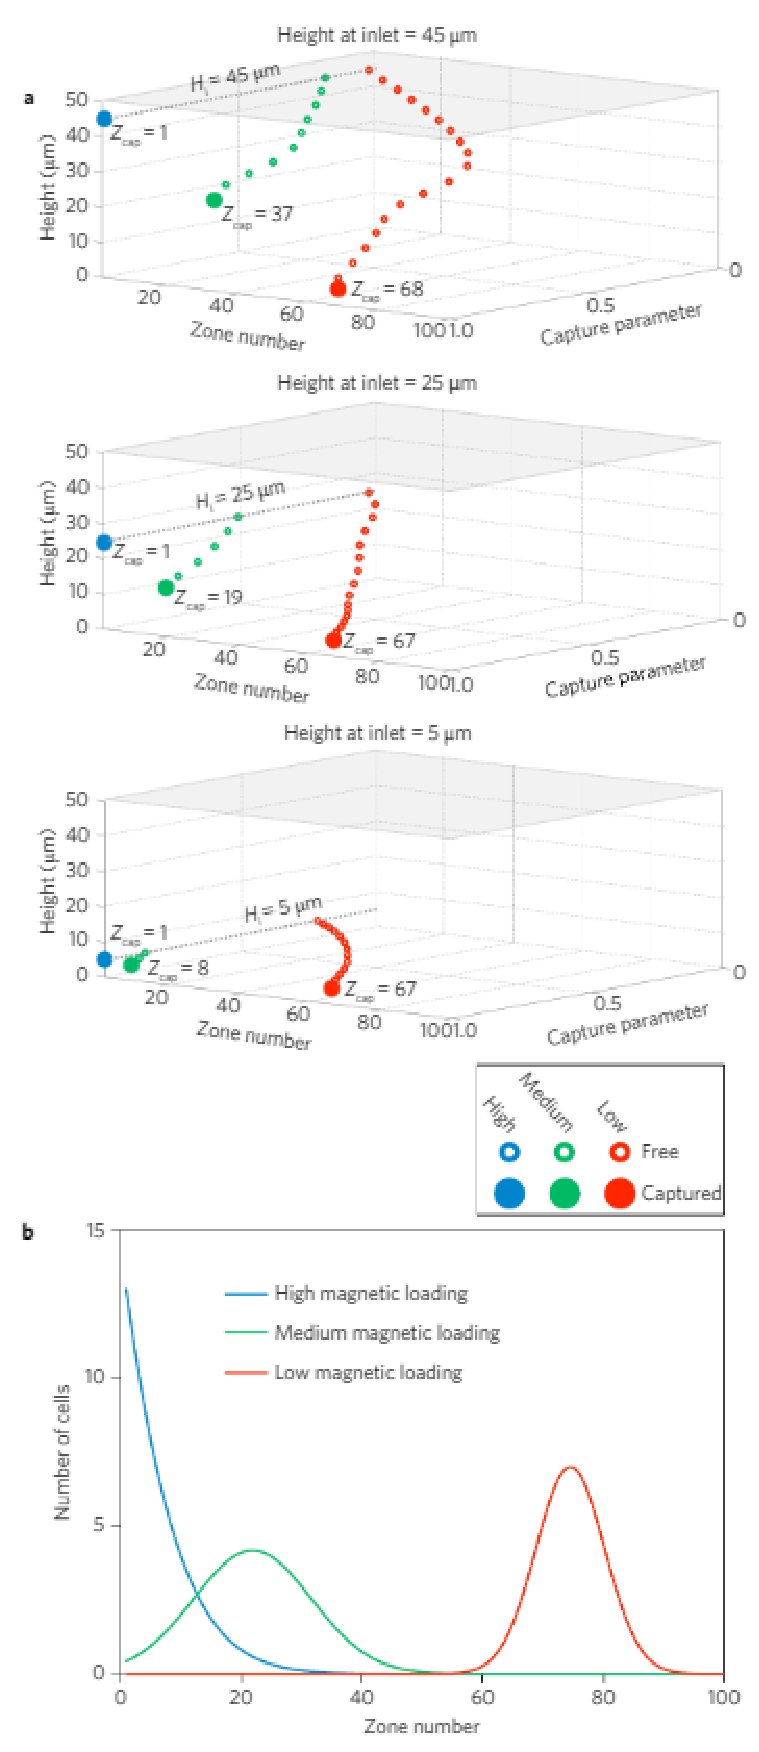
Figure 2 | Modelling of cell capture in the MagRC device. a, Normalized capture parameter as a function of height and capture zone (Zcap) in the chip, for three different inlet heights (Hi). b, A parametric model predicts where cells with high, medium and low magnetic loads will be captured in the MagRC chip. See Supplementary Information and Supplementary Figs 1–3 for an explanation of the model and modelling data.
were achieved (SKBR3 97 ± 3%, PC-3 90 ± 2%, MDA-MB-231 90 ± 3%). The efficient capture of MDA-MB-231 and PC-3 cells, which have a low level of EpCAM, indicates that low-EpCAM cells presented in whole blood samples would still be visualized with this technique.However, in contrast, the CellSearch system exhibits significantlysuppressed capture efficiencies with low-EpCAM cells.
To further validate the phenotypic profiling performance of theMagRC approach in whole blood, we performed head-to-headstudies of blood samples containing 100 cancer cells where bothMagRC and FCM were used for profiling. MagRC profiled cells inthe presence of normal blood cells (Fig. 4c–e), while FCM wasunable to report a specific signal (Fig. 4e). Even in the presence of10,000 cells spiked into blood, a specific signal was not obtainedusing FCM. Only after the blood was treated to lyse red bloodcells could spiked cancer cells be visualized; unfortunately, this pro-cessing step eliminates over 50% of the cancer cells (SupplementaryFig. 8), and therefore creates a considerable potential for false nega-tives. In contrast to FCM, the MagRC approach provides accurateprofiling even with very low levels of cancer cells in unprocessedblood. This is a requirement for the evaluation of CTCs. It is note-worthy that the exact shape of the profile returned with MagRC isaffected by the presence of blood cells (Fig. 4e); however, as it isaffected in a consistent and predictable fashion by the increaseddrag acting on the tumour cells that arises from interactions withthe blood cells, it gives reproducible data for a given type ofsample (for example, whole blood).
The purity of the cancer cells recovered during MagRC profilingwas assessed by counting the numbers of white blood cells (WBCs)that are non-specifically captured within our devices. The MagRCchip depletes up to 99.98% of the WBCs, with approximately 2,000WBCs found in the chip after processing 1 ml of blood. Althoughmuch of this contamination is derived from the non-specificbinding of WBCs to the device, we wondered whether the non-specific binding of magnetic beads could also contribute to thecapture of these cells. We used FCM to compare the specificbinding of particles to MDA-MB-231 cells and the non-specificbinding to WBCs (Supplementary Fig. 4). The data from this exper-iment indicated that the level of non-specific binding of the magneticnanoparticles to WBCs is approximately ten times lower than thatoccurring on low-EpCAM cells, indicating that WBCs would notbe captured within our device via this mechanism. The level ofWBC contamination found in the MagRC chip is comparable toother microfluidic capture approaches, including the micropostCTC chip with∼640 WBCs isolated per 1 ml of blood6, the micro-vortex-generating herringbone-chip with 4,500 WBCs isolated permillilitre9and the tunable nanostructured coating approach with1,200 WBCs isolated per millilitre14. For our approach, along withthe others described where a positive selection approach is used,the ability to identify cancer cells specifically using immunofluorescenceensur es tha t these non-specifically bound cells do not contribute to ther esults obtained.
Monitoring dynamic CTC phenotypes in an animal model
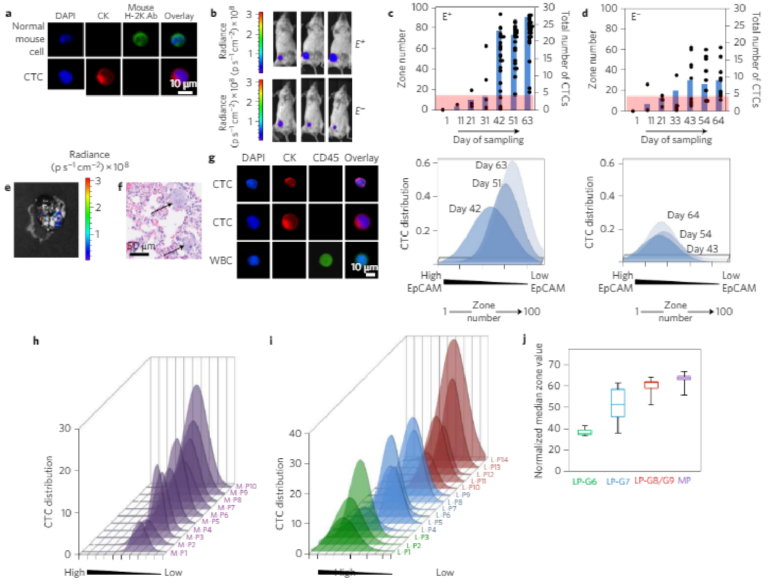
To evaluate the utility of MagRC for the analysis of CTCs and theirdynamic properties, we first analysed blood from mice bearing xeno-grafted tumours as a function of tumour growth. To generate themodel, we implanted MCF-7/Luc human breast cancer cells intothe mammary fat pad of immunodeficient mice. One group ofmice received an estrogen pellet before tumour implantation (E+),as estrogen stimulates MCF-7 tumour growth. Mice in the otherset were not tr e a ted with es trogen befor e tumour implantation (E−).After tumour cell injection, we collected blood from each mouseevery 10 days and analysed the samples using MagRC.Immunostaining that was specific for the implanted human cancercells was used to establish the MagRC profile (Fig. 5a), and tumourgrowth was visualized by imaging the bioluminescence generatedby the luciferin-tagged MCF-7 cells (Fig. 5b).
As tumour growth progressed in the xenografted animals, a markedchange was visualized in the CTCs detected. In both the E+ and
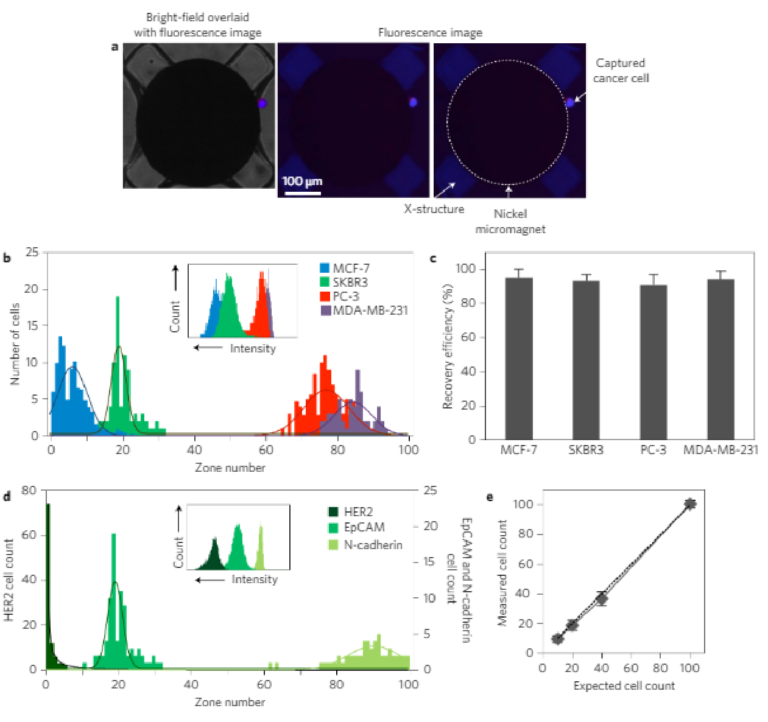
Figure 3 | Profiling protein surface expression using MagRC. a, Bright-field (left) and fluorescent (right) microscope images of a captured immunostained SKBR3 cell. b, Distribution of MCF-7, SKBR3, PC-3 and MDA-MB-231 cells in the MagRC chip; EpCAM was used as the profiling marker. One hundred cells suspended in 100 µl of buffer were used in these trials. Profiling experiments for each cell line were repeated five times. Three replicates for capturing each cell line are shown in Supplementary Information. Inset, EpCAM expression measured by FCM for the three cell lines. c, Capture efficiency for cells that have different levels of EpCAM expression. The high recovery of low-EpCAM cells (MDA-MB-231 and PC-3) proves the suitability of the MagRC approach for monitoring cells with lowered epithelial markers. d, SKBR3 cells were profiled for different cancer biomarkers using three capture antibodies: EpCAM, HER2 and N-cadherin. One hundred cells suspended in 100 µl of buffer were used in these trials, and experiments were replicated three times. Inset, Expression of the same three markers on SKBR3 cells measured by FCM. e, The sensitivity of the MagRC approach was tested by spiking different numbers of SKBR3 cells in the buffer solution and counting them using immunofluorescence after capture in a MagRC chip. A low number of cells (n = 10) spiked into a volume of 100 µl can be visualized. Error bars show standard deviations, n = 3. It is noteworthy that overlap can occur for the profiles collected from different cell lines, reflecting that surface expression levels for some cell subpopulations in different cell lines may be similar. As shown in the inset of b, FCM also generates overlapping profiles
E− animal groups, CTC levels rose as the study progressed. In the E+group, as expected, the CTCs levels increased to a much higher level than in the estrogen-negative group. Notably, in addition to increasing in number, the more aggressive cancer model also exhibited a marked phenotypic shift: the CTCs profiled in these mice were localized in later zones within the Mag RC microfluidic chip compared with early CTCs and cultured MCF-7 cells (Fig. 3b and Supplementary Fig. 9). The profiles indicate that the phenotypes of the CTCs were changing and EpCAM levels were decreasing (Fig. 5c, Supplementary Figs 10 and11). The profiles of the CTCs from the E− mice remained s ta tic(Fig. 5d, Supplementary Figs 10 and 11).
To compare the invasiveness of the tumours in the two groups, we extracted mouse lungs and sent them for histopathology a t the end of the study; these sections were then scanned for micrometastases. Micrometas tases wer e found in lungs of the E+ group (Fig. 5e,f); and there were no micrometastases in the E− group.The presence of the metastases along with the altered CT C profile observed by MagRC is consistent with the hypothesis that the CTCs produced by the E+tumours possess a more invasive profile.
Profiling phenotypes of CTCs in clinical samples
To evaluate the performance of MagRC when tested with clinicalsamples, we conducted a study of samples collected from patientsexhibiting metastatic castration-resistant prostate cancer (mCRPC,n = 10) and localized prostate cancer, (n = 14, Fig. 5g–i andSupplementary Tables 5 and 6). Immunostaining was used to dis-tinguish between CTCs and WBCs (Fig. 5g). We also analysed theblood collected from nine healthy donors (Supplementary Table 4).
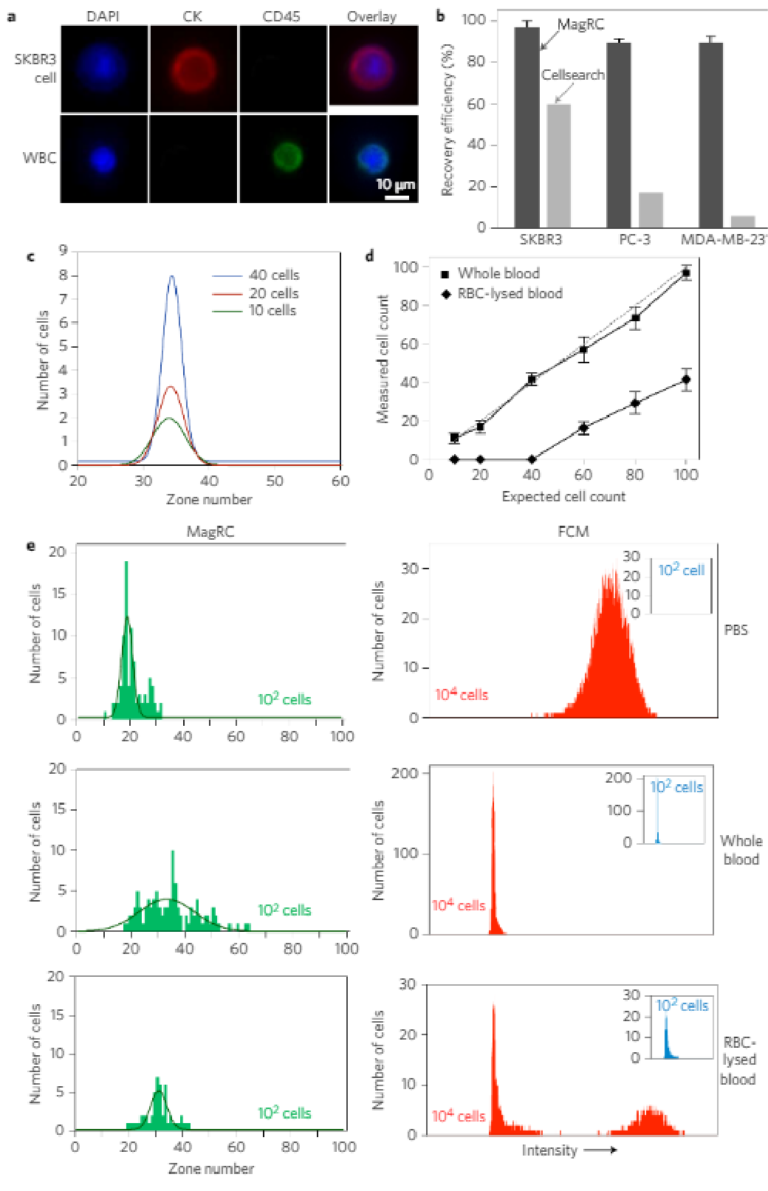
Figure 4 | MagRC applied to rare cells in whole blood. a, Specific immunostaining of cancer cells. After capture, cancer cells are stained for DAPI, CK and CD45. SKBR3 cells were identified as DAPI+/CK+/CD45− and white blood cells were identified as DAPI+/CK−/CD45+. b, Head-to-head comparison of the MagRC chip with CellSearch. One hundred cells of SKBR3, PC-3 and MDA-MB-231 cells were spiked into whole blood. MagRC and CellSearch were used to count cells. CellSearch was inefficient to recover low EpCAM cells while MagRC retains cells with efficiency more than 90%. c, Different numbers of SKBR3 cells were spiked in 1 ml of whole blood and the MagRC chip was used to profile the spiked samples for surface expression of EpCAM. Experiments were repeated three times. d, MagRC was used to count rare cells in unprocessed whole blood samples and red blood cell (RBC)-lysed samples. A significant proportion of cells are lost when this sample processing step is used. In unprocessed blood, MagRC shows high levels of sensitivity and linearity. See Supplementary Fig. 8 for raw data. Cells were spiked into 1 ml of human blood for all trials shown. Error bars show standard deviations, n = 3. The dashed line shows the ideal 100% capture efficiency and the solid lines show the counts extracted from the MagRC chip. e, The MagRC chip (left) and FCM (right) were used to monitor cells in PBS (top), whole blood (middle) and RBC-lysed blood (bottom). The MagRC chip was able to accurately profile cells in all three solutions. However, the background signal for the whole blood samples overwhelmed the signals collected via FCM; only cells in PBS and RBC-lysed blood samples were accurately measured using the technique. Owing to the inability of FCM to accurately count low (∼100) numbers of spiked cells (inset), samples with a higher level of SKBR3 cells (104) were measured and counted using FCM. Profiling with both FCM and MagRC was repeated three times. The curves in the MagRC profiles present the normal distribution fit to the count data.