Controlling bead and cell mobility in a recirculating hanging-drop network
Nassim Rousset , Martina de Geus , Vittoria Chimisso , Alicia J. Kaestli , Andreas Hierlemann and Christian Lohasz
Integrating flowing cells, such as immune cells or circulating tumour cells, within a microphysiological system is crucial for body-on-a-chip applications. However, ensuring unimpeded recirculation of cells is a significant challenge. Closed microfluidic devices have a no-slip boundary condition along channel walls and a defined chip geometry (laminar flow) that hinders the ability to freely control cell flow. Open microfluidic devices, where the bottom device boundary is an air–liquid interface (ALI), e.g., hanging drop networks (HDNs), offer the advantage of an easily-actuatable fluid-phase geometry, where cells can either flow or stagnate. In this paper, we optimized a hanging-drop-integrated pneumatic-pump system for closed-loop recirculation of particles (i.e., beads or cells). Experiments with both beads and cells in cell culture medium initially resulted in particle stagnation, which was suggestive of a pseudo-no-slip boundary condition at the ALI. Transmission electron microscopy and dynamic light scattering measurements of the ALI suggested that aggregation of submicron-scale cell-culture-medium components is the cause of the pseudo-no-slip boundary condition. We used the finite element method to study the forces on particles at the ALI and to optimize HDN design (drop aperture) and operation (drop height) parameters. Based on this analysis, we report a phase diagram delineating the conditions for free flow or stagnation of particles at the ALI of hanging drops. Using our experimental setup with 3.5 mm drop apertures, we conducted particle flow experiments while actuating drop heights. We confirmed the ability to control the flow or stagnation of particles by actuating the height of hanging drops: a drop height over 300 μm led to particle stagnation and a drop height under 300 μm allowed for particle flow. This particle-flow control, combined with the ease of integrating scaffold-free organ models (microtissues or organoids) in HDNs, constitutes the basis for an experimental setup enabling the control of the residence time of single cells around 3D organ models.
We kindly thank the researchers at ETH Zürich for this collaboration, and for sharing the results obtained with their system.

Introduction
Designing microfluidic devices for cell culturing, especially multi-tissue cultures, has led to approaches that interconnect 2D or 3D cultures of different cell types (tumour, brain, liver, heart, etc.) through microchannels in a physiologically relevant combination and ratio.1 These microphysiological systems (MPSs) are often considered the next step in preclinical research toward more comprehensive and physiologically relevant in vitro testing systems.2,3 The interest in MPSs is mainly based on their potential to better predict the effect of compounds on processes in the human body4,5 and to better understand – in a more systemic way – how different healthy and diseased organs interact with each other3,6,7 when compared to traditional preclinical in vitro models. The potential applications of MPSs include pharmaceutical research and compound testing,8 basic research on tissue and cell interaction,9 and disease progression studies.10
One of the current challenges for MPS applications is the interaction between solid tissues and suspended cells, e.g., circulating tumour cells or immune cells. Such interaction studies are particularly interesting to, for example, mimic immunotherapeutic approaches,9 and recapitulate the interaction dynamics of circulating tumour cells11 and immune cells12 with other organs. Some strategies rely on a static interaction between cell suspensions surrounding solid tissues,13 ignoring the physiological behaviour of immune cells that migrate toward and around their target.14 Hydrogel-based approaches can generate stable signalling gradients that may guide the migration of immune or tumour cells.15 However, these approaches ignore the circulatory nature of immune cells that move around due to blood flow.
To enable the interaction between suspension cells and a series of immobilized tissue constructs, a liquid-phase transport system is needed. However, emulating a circulatory system with microfluidics is not trivial, as it requires flowing single cells that interact with a static organotypic tissue model over several days. Furthermore, a closed-loop recirculation of cells is crucial for the build-up of relevant concentrations of signalling molecules, e.g., cytokines and chemokines, and appropriate tissue/suspension cell interaction.9 Recent advances in achieving cell recirculation have been demonstrated,9,16 but have yet to meet the requirement of maintaining stable and long-term cell recirculation. The requirements of efficient cell recirculation are (i) minimizing cell/microfluidic structure interactions, (ii) minimizing cell stagnation, and (iii) minimizing cell agglomeration in larger chambers that are used to host tissue models.
Open microfluidic systems – such as hanging-drop networks (HDNs) – are particularly suited to meet the requirements detailed above.17 HDNs feature hanging drops, interconnected through microfluidic channels (Fig. 1a). Tissue models can be immobilized and cultivated within the individual drops, while fluid flow through the channels is used to establish inter-tissue communication through various signalling molecules. A key feature of such open systems is an air–liquid interface (ALI). ALI in this manuscript does not refer to epithelial cells exposed to air but to the interface between an air and a liquid phase. The ALI largely reduces the interaction between cells and microfluidic channel structures – e.g., SU-8 or polydimethylsiloxane (PDMS) – and that allows for direct optical access to the tissue and cell models with an inverted microscope (Fig. 1b). Additionally, the ALI in open microfluidic systems provides ample oxygenation, which reduces the risk of hypoxia-related cytolytic and migratory activity of immune cells, as well as cell death.18 An open microfluidic system also enables free liquid flow, where no stress is present at the ALI. The no-stress ALI boundary gives full control over the drop height (Fig. 1b) during an experiment. Free liquid flow also ensures continuous cell flow through the system due to the slip boundary condition (Fig. 1c) at the ALI. In contrast, free cell flow is not guaranteed within closed microfluidic systems, where the no-slip boundary condition at channel walls and rigid structures reduces the flow velocity (flow velocity is null at the walls), which gives only little freedom with chip operation and causes cell aggregation upon recirculating cells (Fig. 1d).

Fig. 1 Cell-mobility control scheme. (a) Schematic representation of a hanging-drop network (HDN) featuring four hanging-drop structures with in- and outlet drops at either end. (b) Colinear-to-flow cross-section of a typical hanging-drop compartment unit of an HDN. A hanging drop is connected to the network through microfluidic channels. The aperture (2a) of the drop is a design-defined constant. The height (h) of the drop can be controlled during an experiment. The air–liquid interface (ALI) is the key feature of HDNs, giving a slip boundary condition. (c) Visualization of the flow-velocity profile through an open microfluidic system. No stress is present at the ALI, which results in a slip boundary condition, where the flow velocity is maximal at the ALI. The slip boundary condition allows for unimpeded cell (orange) flow over time, even as cells settle due to gravity. (d) Visualization of the flow velocity profile through a closed microfluidic system. The no-slip boundary condition, caused by stiction of the outermost liquid-phase layers to the channel boundaries, sets the flow speed to zero. This may cause cells to stagnate and stick to the channel wall surface, particularly at the bottom where they settle due to gravity.
An HDN enabling closed-loop recirculation of fluids has been developed and validated in our laboratory.19 A unidirectional flow was achieved with an integrated-pump concept developed specifically for microfluidic HDNs. Here, we show a novel iteration of the device, which is aimed at flowing cells in a closed loop and controlling their interaction time with microtissues.
Preliminary tests with beads showed an unexpected behaviour. The slip boundary condition allowed for successful bead recirculation within de-ionized water. However, we observed a no-slip-like stagnation of particles (cells and beads) during recirculation within cell culture medium.
Mathematical modelling of the ALI as a slip or no-slip boundary with the finite element method (FEM) helped to explain this unexpected no-slip-like stagnation. The FEM is a widely used tool to model, predict, and characterize fluid dynamics within microfluidic chips. This modelling technique allows for computing hydrodynamic forces on spherical objects.20–22 We computed the forces on particles at the ALI, while varying operational parameters – e.g., drop height – and design parameters – e.g., drop aperture – for a set of defined experimental conditions.
The aim of this study was to investigate the forces on and behaviour of beads at the ALI as a surrogate for cell behaviour, which we thereafter confirmed experimentally with cells. Our goal was twofold: on the one hand, we wanted to find conditions where particles can freely recirculate within our device, despite the unexpected stagnation; on the other hand, we wanted to control particle stagnation in order to modify particle residence time in the hanging drop at will. Our theoretical and experimental findings suggest that, although the no-slip behaviour of liquid at the ALI is anomalous in cell culture media, careful experimental design can still enable unimpeded particle flow.
Experimental
Flowing particles
The flowing beads were 8.0 ± 0.1 μm-diameter and 1.05 g cm−3-density polystyrene beads (Sigma-Aldrich, Buchs, Switzerland). They were suspended in de-ionized water or cell culture medium depending on the experiment.
The flowing-cell model used here was THP-1 (TIB-202; ATCC, Manassas, VA, USA), a human acute monocytic leukaemia cell line. THP-1 cells were cultured according to ATCC protocols and maintained in RPMI-1640 (PAN-Biotech GmbH, Aidenbach, Germany), supplemented with 10% foetal bovine serum (Sigma-Aldrich, Buchs, Switzerland) and 1% penicillin and streptomycin (Sigma-Aldrich, Buchs, Switzerland). The cell culture medium was filtered through a 0.2 μm-pore-sized filter (Thermo Fisher Scientific, Waltham, MA, USA) to ensure fibre-, aggregate-, and contaminant-free culture and microfluidic HDN operation. Cells were cultured in non-adherent flasks (Greiner Bio-One, Frickenhausen, Germany) at 37 °C, 5% CO2, and 95% humidity. Cells were subcultured every 2 to 3 days at a ratio of 1[thin space (1/6-em)]:[thin space (1/6-em)]5 to maintain a density of 0.2–1 × 10⁶ cells per mL. Cell-culturing density was kept at these levels to ensure spherical cell morphology, because higher densities were shown to alter cell morphology.23
Device fabrication
The fabrication process of the microfluidic device was identical to that of our previously published device19 with two PDMS (Sylgard 184, Dow Corning GmbH, Wiesbaden, Germany) layers – a microfluidic and a pneumatic layer – and a glass substrate to ensure device stability. A micrograph of the fabricated device is shown in Fig. 2a and b. A schematic illustration of the chip layout is shown in Fig. 2c–e.

Fig. 2 Hanging-drop network microphysiological system with on-chip pump drops for particle recirculation.
Picture of the recirculating hanging-drop network (HDN) filled with blue ink showing (a) the air–liquid interface and (b) the transparent slide with inlets and a digitally inserted highlight of pneumatic chambers. The fabricated chip consists of 2 PDMS layers: (c) a 750 μm-thick microfluidic network layer and (d) a 5 mm-thick pneumatic channel layer. (c) Schematic of the microfluidic layer of the recirculating HDN. A 2 × 3 on-chip pump drop setup, highlighted in orange at the top, increased the flow rate within the device. Four culture drops, highlighted in green at the bottom, enabled flowing-cell analysis and could accommodate tissue co-culturing. The sample inlet enabled the introduction of a cell suspension to the device with minimal chip handling. The height-control inlet enabled the in- and outflow of liquid with a syringe pump to maintain the drop height or actuate it to the desired value. (d) Schematic of the pneumatic layer of the recirculating HDN. The heigh-control, sample, and pneumatic inlets are 0.75 mm-diameter holes. The height-control and sample inlets were punched through to the microfluidic layer. Three pneumatic inlets control three separate pairs of on-chip pump drops (highlighted in white and red in b and in orange in c). (e) Side-view cross-section A (dashed line in c and d) of the device with a hanging drop (dimensions in μm). The side view shows that a 250 μm-thick PDMS layer (part of the microfluidic layer) seals the pneumatic layer. The microfluidic and pneumatic layers were plasma-bonded together (A-labelled dashed line in e). The pneumatic layer was bonded onto a transparent slide (not shown on cross-section) to ensure chip rigidity and optical access to the drops. Upon pressurizing the pneumatic chambers (red-labelled height), the 250 μm thick PDMS layer (black-labelled height) expands into the volume of the drop below. The red-coloured pneumatic chambers were actuated simultaneously and in an alternating pattern with the white-coloured pneumatic chambers. Combined with the integrated valves (yellow structures in c and e), the pumping produced a unidirectional flow (blue arrows in c). The positions of the integrated valves defined the flow direction. All interconnecting channels were 300 μm wide. All microfluidic structures were 500 μm high (blue-labelled height in e).
For the microfluidic layer (Fig. 2c), two masks were used to generate an SU-8 (Microchem Corp., Newton, MA, USA) microfluidic-channel master mould on a silicon wafer. We used a 7[thin space (1/6-em)]:[thin space (1/6-em)]1 PDMS-to-curing agent ratio to ensure stiff and reliable valve operation. For the pneumatic layer (Fig. 2d), one mask was used to generate the cavity master mould on a silicon wafer. We used a normal 10[thin space (1/6-em)]:[thin space (1/6-em)]1 PDMS-to-curing agent ratio for the pneumatic layer. Alternatively, with the aim to simplify the fabrication process, we 3D-printed a mould design identical to the one previously fabricated by photolithographic processes. We used a 3D printer designed for microfluidics (PR110-385, CADWorks3D, Toronto, Canada) with the dedicated “PDMS Mastermold” resin (CADWorks3D, Toronto, Canada) to 3D-print the mould. We used a high-intensity UV post-curing solution (Professional CureZone, Creative CADWorks, Concord, ON, Canada) to ensure proper curing of the resin.
For chip assembly, 0.75 mm diameter inlets were first punched in the pneumatic layer. After aligning and bonding both PDMS layers, 0.75 mm diameter inlets were punched for the sample and height-control drops through to the microfluidic layer. One of two processes was used to bond the resulting PDMS chip onto a supporting slide with 1.2 mm-diameter holes matching the chip inlets, which provided a stiff substrate to suspend the chip in a hanging-drop configuration. Process 1: following plasma activation, we aligned and bonded the PDMS chip onto a glass slide with drilled holes. Process 2: using double-sided tape, we bonded the PDMS chip onto an acrylic slide with laser-cut holes.
Design changes with respect to our previously published device19 included (i) the reduced pitch between culture drops to minimize travel time of the cells and (ii) the addition of height-monitoring drops (Fig. 2c). Two parallel and 3-pumping-drop configurations were designed to increase the flow rate in the device.
Flow-rate measurement
Measuring the flow rate was done by imaging the circulating beads in the channel between the height-monitoring drops and the height-control-inlet. Videos were taken at 5 frames per second, and particles were traced manually. The flow rate was calculated by multiplying the average velocity of particles in the channel by the channel cross-section of 0.3 × 0.5 mm2. All experimental images, time lapses and videos were acquired using an inverted wide-field microscope (Leica DMI6000B, Leica Microsystems, Switzerland) with a 10× lens.
Mathematical models
The finite-element method software, COMSOL Multiphysics® v. 5.4 (COMSOL AB, Stockholm, Sweden) was used to model a single hanging drop (Fig. 1b). A full 3D model of the liquid phase of a hanging drop was established using the laminar-flow module to solve the Navier–Stokes equation. The built-in physical properties of water were used for the liquid phase. The boundary conditions were set to “no slip” for the PDMS-water interfaces, constant “inflow” for the channel inlet, constant null “pressure” for the channel outlet, and “slip” (Fig. 1c) or “no slip” (Fig. 1d) for the ALI. We placed and moved, via a parameter sweep, a small particle at the ALI. Parametric sweeps were used to find the flow velocities and pressures for every modelled condition. We elaborate on the sweeping strategy in the “Particle-flow modelling strategy” section of the results. The hydrodynamic force on spherical particles at the ALI was computed by using the built-in reaction force (reacf) operator within COMSOL and summing it over the surface area of the spherical particle.
Transmission electron microscopy
Transmission electron microscopy (TEM) was used to image the nanostructures present at the ALI and in the medium. TEM images were acquired with a Philips Morgagni 268D microscope. Each sample was deposited on a carbon-coated copper grid by gently touching the ALI with the flat side of the TEM grid. The samples were blotted, washed with MilliQ water and negatively stained with 1% phosphotungstic acid (PTA). TEM images were acquired with an acceleration of 90 kV, and each grid was imaged at three different sites.
Dynamic light scattering
Dynamic light scattering (DLS) was used to determine the hydrodynamic radius (DH) of the particles present in the cell medium. The DH was calculated from scattering data collected using the Zetasizer Nano ZSP DLS measurement system (Malvern Panalytical, Volketswil, Switzerland).
The samples were prepared by transferring the content of four hanging drops to 100 μl of MilliQ water, and then analysed. Measurements were performed at 20 °C with non-invasive backscattering (NIBS) technology. Results were directly processed and displayed by the built-in software (Zetasizer software).
Results
Particle-flow characterization
To achieve free flow of suspended particles through an open microfluidic system, we used an HDN composed of a sequence of drops, connected by channels, where each drop acted as a potential tissue compartment (Fig. 2a and b). Perfusion in a closed-loop system was induced by pneumatically actuating integrated on-chip pump drops (Fig. 2c–e) developed in our laboratory.19 Unidirectionality of the flow was achieved with integrated valves actuated through pneumatic inlets (Fig. 2c). This strategy reduced the large dead volume of – and prevented repeated squeezing of cells by – the peristaltic pump mechanism. Such integrated pneumatic pumps have a maximum possible flow rate that is defined by the microfluidic network design.19 A bead or cell suspension can be loaded into the system through the sample inlet in Fig. 2c to be recirculated within the HDN. The drop height and device level can be precisely monitored through height-monitoring drops (Fig. 2c) that were loaded with thin rings.24,25 Height-monitoring drops are positioned at the periphery of the device and fluidic system, thereby allowing to fine-tune the drop height at micrometre-precision prior to and during an experiment. Continuous drop-height control was achieved with an open-source “Droplet Based Microfluidics” software package implemented in YouScope,26 where the focal position of the aforementioned thin ring was kept constant by infusing or removing medium through the height-control inlet (Fig. 2c).
The chip shown in Fig. 2 was used to assess bead and cell mobility in the HDN. The experiments were conducted on an inverted microscope with an incubation box keeping the setup at 37 °C, 5% CO2, and 95% humidity. The chip was prefilled with either de-ionized water or culture medium. The pneumatic lines, set to an air pressure of 40 kPa, were connected to the pneumatic inlets (Fig. 2d) actuating the on-chip pump drops (Fig. 2c). The pump actuation protocol consisted of alternatively actuating the pneumatic inlets, highlighted in red and white (Fig. 2d), and was run for the duration of the experiment. The timing of the pump actuation protocol is ton = 200 ms, toff = 200 ms with a 200 ms delay between the red and white pneumatic valves. This scheme was previously optimized to achieve the highest flow rate possible of 1 μL min−1.19 The drop height of the height-monitoring drops was maintained at 550 μm, per previous protocols,19 by connecting a syringe of de-ionized water to the height-control inlet and by using our feedback controller26 as previously described.24 De-ionized water instead of cell culture medium for height-control was used to avoid changes in medium osmolality through evaporation of water and up-concentration of salts, proteins, and other molecules in the medium. At the start of every experiment, 10 μL of either polystyrene beads or THP-1 acute monocytic leukaemia cells were added to the sample inlet (Fig. 2c) with a seeding density of 0.7–7 × 10⁶ particles mL−1. The effective flow rate of 1 μL min−1 was determined by measuring the average speed of single beads or cells through the channel connecting the height-monitoring drop and the height-control inlet.
First results shown in Fig. 3a indicated that beads in de-ionized water circulated continuously over the course of the experiment. The slip boundary condition at the ALI (Fig. 1b) allowed for rapid recirculation. However, cells and beads in cell culture medium settled to the bottom of the drop and stagnated within a few hours (Fig. 3b). This observed stagnation would be typical of a no-slip boundary condition (Fig. 1c). This behaviour was unexpected, considering that the density and viscosity of our cell culture medium did not deviate significantly from that of de-ionized water.27 This observed stagnation led to the hypothesis that the complex cell culture medium formulation (containing RPMI 1640 and 10% Foetal Bovine Serum – FBS), which includes various salts, amino acids, vitamins, nutrients, and other additives, may change the boundary conditions at the ALI to exhibit a behaviour featuring aspects of a no-slip boundary condition, i.e., a pseudo-no-slip boundary condition. As ALIs have been shown to accelerate protein crystallisation,28 we hypothesized that protein denaturation due to shear and the ALI29 may have caused this unusual hydrodynamic behaviour.
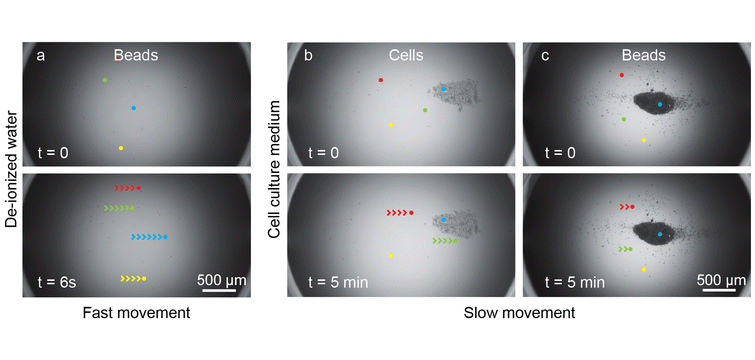
Fig. 3 Observation of cells and beads within the microfluidic hanging drops at a recirculating flow rate of 1 μL min−1.
The drop aperture diameter was 3.5 mm, and the drop height was 550 μm. We highlight 4 particles in each snapshot (red, green, blue, and yellow dots) with their displacement over one frame marked up with arrows. (a) De-ionized water featured rapid bead movement at the ALI over 6 seconds. The snapshots of the bead flow were taken from a 16 h time lapse video. (b) and (c) Cell culture medium featured comparatively slow particle movement over 5 minutes as well as cell (b) and bead (c) stagnation at the bottom of the hanging drop. The snapshots of cell and bead stagnation were taken a few hours into a 19 h time lapse video, which suggested a significantly different hydrodynamic behaviour within the cell culture medium when compared to that in de-ionized water. The time difference between the first and second row was chosen to highlight a comparable displacement. The time difference of 6 seconds for the de-ionized water condition compared to 5 minutes for the cell culture medium condition indicates that particles at the bottom of the hanging drop have a slower movement, and a stronger tendency to form stagnation areas in cell culture medium than in de-ionized water, despite operating the chip with the same recirculating flow rate.
Particle-flow modelling strategy
To investigate the pseudo-no-slip boundary condition, we modelled the forces acting on spherical particles (i.e., cells or beads) at the ALI. Hydrodynamic forces are the only ones that vary between flow in de-ionized water vs. cell culture medium. Therefore, computing the hydrodynamic forces on particles was key to studying cell and bead stagnation. To do so, we computed the flow in the hanging drop with a particle at a given location (Fig. 4a). We used the solution on the particle surface (Fig. 4b) to compute the hydrodynamic force.

Fig. 4 Particle-flow modelling strategy. (a) and (b) show COMSOL simulation results with a slip boundary condition at the ALI. (a) Flow velocity profile (surface plot) and streamline solutions of the flow in the colinear-to-flow middle cut plane of the hanging drop. (b) Zoomed-in view of the square box in figure (a) showing a modelled particle of 8 μm diameter at the ALI. The hydrodynamic force is computed by summing the reaction forces of the flow on the surface (computed with the built-in reacf operator in COMSOL). (c) Schematic of the forces acting on particles at the ALI and (d) superimposition of the modelled net tangential force (white vector field) and its magnitude (coloured contour map) on the experimentally observed stagnation of beads at the bottom of the drop from Fig. 3c. The diameter of the drop in the image is 3.5 mm. The experimental drop height is 550 μm. The experimental flow rate is 1 μL min−1.
Particle free-body diagram. The free-body diagram of a particle (Fig. 4c) shows the forces that come into play when analysing free flow of particles at the ALI of a hanging drop. The externally acting forces are hydrodynamic, gravitational, and normal forces. The hydrodynamic force (Fhyd, green dashed vector in Fig. 4c) is caused by differentials in fluid pressure around the particle caused by the moving flow. The gravitational force (Fg, orange dashed vector in Fig. 4c) includes the weight of the particle and the buoyant force in medium. The normal force (F⊥, purple dashed vector in Fig. 4c) is derived from Newton's third law of motion and is the normal force of the ALI acting on the particle, stopping it from crossing the ALI.
We modelled Fhyd numerically by assuming a worst-case no-slip ALI boundary condition for the experimental results and conditions displayed in Fig. 3b and c. Fg was computed using the density of the particle and the density of the medium. The normal force of the particle on the ALI was computed by projecting the sum of hydrodynamic and gravitational forces on the normal vector of the particle-ALI contact point. F⊥ of the ALI on the particle is the negative of the previously computed force. F⊥ only exists if forces push the particle toward the ALI and is due to surface tension exceeding hydrodynamic forces. The net tangential force (F∥, black vector in Fig. 4c) is computed by adding all three external forces acting on the particle and is the force translating the particle along the hanging-drop surface.

The resulting net tangential force vectors (F∥, white vector field in Fig. 4d) and their magnitudes (coloured contour map in Fig. 4d) were superimposed on an experimental snapshot of the stagnation area observed for the case of polystyrene beads in cell culture medium within a hanging drop (Fig. 3c).
We estimated the minimum net tangential force required to ensure free flow of beads when assuming a no-slip boundary condition at the ALI (minimum F∥ for flow). To do this, we modelled higher flow rates, where a stagnation area is no longer present (ESI† Fig. S1, no-slip boundary condition). With a flow rate of 6 μL min−1, we estimated the minimum F∥ for flow at ∼100 fN.
Alternatively, we modelled a slip boundary condition at the ALI. This alternative did not yield a condition in which particles would stagnate, except for flow rates 20-fold lower than what was experimentally measured (ESI† Fig. S1, slip boundary condition). The use of a slip boundary condition did not yield the observed experimental result in Fig. 3b and c and 4d.
Therefore, with F∥ magnitudes under 100 fN, Fig. 4d supports our hypothesis that modelling a no-slip boundary condition at the ALI is a successful approach to predict the experimental stagnation area.
Parametric sweep. The numerical model, supported by the experimental observation of stagnation in Fig. 4d, allowed us to perform a broad parametric sweep on design (drop aperture) and operation (bead position and drop height) parameters of hanging drops for a working flow rate of 1 μL min−1.
The upper limit for the size of a hanging drop for the parametric sweep was found by the capillary length (l) in eqn (2).30 This size was found via the Eötvös or Bond number, which establishes the ratio of gravitational forces, pulling the drop down, to capillary forces, hanging the drop up.

Here, γ is the water surface tension, 0.0727 N m−1 at 20 °C or 0.0709 N m−1 at 37 °C,31ρ is the water density, 998.2 kg m−3 at 20 °C or 993.3 kg m−3 at 37 °C,32 and g is the gravitational acceleration, 9.8 m s−2. These values yield a capillary length of 2.73 mm at 20 °C or 2.70 at 37 °C. This capillary length is calculated for the case where the surface tension is highest, i.e., with de-ionized water, which gives a maximum size value. A hanging drop with a radius equal to the capillary length (5.4 mm in diameter) will have a perfect equilibrium between its weight and surface tension. However, designing such a drop in a microfluidic network would be very unstable, since any hydrodynamic force on the interface would cause it to burst.33 Through previous experiments (data not shown), we have established that the practical upper limit for the diameter of a hanging drop within an HDN is 4 mm. In practice, the smaller the diameter of the hanging drop, the more stable it is.
Ultimately, modifying the design is laborious and requires optimizing the microfluidic network, device fabrication, and validating its functionality. On the other hand, modifying the drop height is doable during device operation by simply adding or removing liquid from one of the inlets of the system (Fig. 2c). Hence, for the purpose of this work, we wanted to find an aperture that enabled both, particle stagnation and flow.
Therefore, we carried out a parametric sweep on the drop aperture diameter (2a) from 0.5 mm, which is approximately twice the width of our channels (Fig. 2c), to 4 mm, which is the practical upper limit. A scheme of varying drop aperture radii (a) is shown in Fig. 5a. We also carried out a parametric sweep on the drop height (h) as seen in Fig. 1b relative to the drop aperture radius (Fig. 5b). The h/a parametric sweep varied from a flat drop at h/a = 0 to a hemispherical drop at h/a = 1.

Fig. 5 Parameter sweep results. (a–c) Schematics showing the parametric sweep methodology. (a) Schematic of the parametric sweep over the drop aperture radius (a) for a constant drop-height-over-aperture (h/a) ratio. (b) Schematic of the parametric sweep over the drop height (a), varying the h/a ratio for a constant drop aperture. A schematic representation of a bed of particles, constituting the stagnation area, is shown in green at the ALI. (c) Schematic of the parametric sweep over the particle's x position relative to the drop aperture radius, taken at the worst-case symmetry plane of the ALI. A schematic representation of particles (green circles) at various positions is shown at the ALI. (d) Plot of the h/a ratio required to expel a bead from a hanging drop at each bead position for various drop apertures. The stagnation area is delineated for a given h/a ratio of 0.6 (dashed red line) and a drop aperture diameter (2a) of 1 mm. This stagnation area implies that, if a particle settles at the ALI between x/a = 0.2 and 0.9, it will stagnate. The minimal h/a ratio (dash-dotted red line) is referred to as the “critical h/a ratio” under which no stagnation area is present. (e) Phase diagram showing the critical h/a ratio under which free bead or cell flow is allowed. Over a h/a ratio of 0.6, potential HDN instability can be observed and is further described in the discussion. The actual drop height in mm is shown for the given critical h/a ratio (dashed red line). The apparent local extrema in the dashed red line are numerical artefacts due to the parameter sweep steps of the critical h/a ratio.
Modelling particles at various positions (x) on the symmetry axis of the hanging drop (Fig. 5c) with a parametric sweep pointed out the worst-case scenario for particle stagnation. Since upstream particles (x/a < 0) are inevitably dragged down to the ALI due to gravity, it is sufficient to only model particles at positions from the bottom of the ALI to its apex downstream, as the particles need to be pushed out of the hanging-drop compartment by the hydrodynamic flow. Therefore, we modelled particle positions from x/a = 0 to x/a = 1.
Modelling results
Our model provided an h/a ratio that is required to ensure that particles flow at each position in Fig. 5d for drop aperture diameters of 1, 2, 3 and 4 mm assuming a no-slip boundary condition at the ALI. Fig. 5d confirms that the centroid of the stagnation area is downstream of the hanging drop, as shown experimentally in Fig. 4d. As expected, larger drop apertures require smaller h/a ratios to ensure free flow of particles. In other words, the critical h/a ratio is inversely proportional to the drop aperture. For example, for a diameter of 1 mm, Fig. 5d shows that an h/a ratio under ∼0.43 allows for free flow of particles at the ALI. This data point and the absolute drop height (215 μm) were thereafter transferred to Fig. 5e. This process was repeated for every drop aperture, generating the black and red dashed lines of the phase diagram (Fig. 5e).
The phase diagram of Fig. 5e shows the critical h/a ratio to enable free particle flow in HDNs for a wide range of drop apertures. Fig. 5e essentially compares the operational parameter (drop height) on its y-axis to the design parameter (drop aperture) on its x-axis. The critical drop height in mm appears to plateau at 0.3 mm for drop aperture diameters larger than 2 mm. The optimal drop aperture then depends on the application and will be elaborated further in the discussion.
For our experiments, we used the existing on-chip pump and HDN design, which featured drop aperture diameters of 3.5 mm and still allowed for particle flow control.19 The model's findings are summarized in Fig. 6a for our 3.5 mm HDs and the particles of interest. The model predicts free particle flow for a drop height under 300 μm, i.e., at an h/a ratio under 0.17.
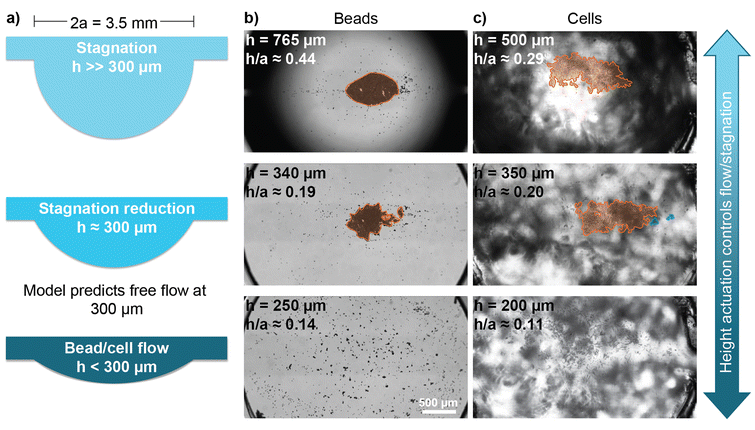
Fig. 6 Experimental validation of the phase diagram of Fig. 5e. a) Schematics of the various drop heights show the control over the h/a ratio. b) Images of the bead stagnation area (orange) for various drop heights. After waiting a few hours for bead stagnation, the drop height was actuated. The results show that, as expected, the stagnation area shrank before disappearing completely. ESI† Video S1 shows the videos from which the frames were taken. c) Images of the cell stagnation area (orange) and floating clusters (blue) for various drop heights. The noise in the background is due to the double-sided tape (process 2 described in the “device fabrication” section) used to bond the chip to the transparent slide support and does not affect the results otherwise. This double-sided tape was not used for the experiments in subpanel b. After waiting a few hours for cell stagnation, the drop height was actuated. The results show that, as expected, the stagnation area shrank before disappearing completely. ESI† Video S2 shows the videos from which the frames were taken.
In practice, since we are looking at phase diagrams, the h/a ratios in this study are rather indicative than decisive. There are two clear particle behaviours (phases) and a general transition (line) between these phases that is highly dependent on particle size, the effect of a stagnating pellet, static friction, adhesion, etc.
Experimental particle-flow control
Using the same methodology as for the experiments in Fig. 3, we tested the model's findings (Fig. 6a) experimentally by flowing polystyrene beads in cell culture medium around the closed-loop HDN.
After a few hours of recirculation, bead stagnation was apparent, and we started actuating the drop height over several hours. With our existing drop aperture diameters of 3.5 mm and an experimentally measured flow rate of 1 μL min−1, the flow or stagnation of beads in cell culture medium could be successfully controlled by actuating the drop height (Fig. 6b).
With these findings for beads in cell culture medium, we repeated the experiment with THP-1 cells in cell culture medium. We found similar results for cells (Fig. 6c) when compared to beads flowing in cell culture medium. We noted that the visible background noise in Fig. 6c was caused by the double-sided tape used to bond the chip to its support slide in this experiment and did not affect flow results otherwise. We observed that the transition from a small stagnating particle bed (stagnation reduction in Fig. 6b and c) to unimpeded particle flow (particle flow in Fig. 6b and c) required gentle percussion, i.e., tapping the setup.
Microscopic investigation of the air–liquid interface
To investigate the changes that occur at the ALI and that generate the pseudo no-slip boundary condition, we performed transmission electron microscopy (TEM). Therefore, cell culture medium was recirculated through our HDN and was sampled after 0 h, 3 h, and 24 h (Fig. 7). The images obtained by TEM of stock cell culture medium (Fig. 7; first row) showed an abundance of micelles and small self-assembled structures (DH ∼ 20 nm and 100 nm respectively) and the presence of few large aggregates (>1 μm). TEM of the ALI after 3 h (Fig. 7; second row) showed an overall decrease in the number of single micelles on the grid, displaced by worm-like micelle aggregates, and larger aggregates resulting from them. TEM of the ALI after 24 hours (Fig. 7; third row) showed an abundance of the same micelle chains and structures deriving from their uncontrolled aggregation, as well as some salt precipitates. These results suggest that there is an induced aggregation of some medium components into larger aggregates, which could have an influence on the ALI's properties. Hence, the no-slip-like behaviour could be linked to the formation of aggregates over time.

Fig. 7 Transmission electron microscopy (TEM) and dynamic light scattering (DLS) results. Results are shown for stock cell culture medium (first row) and hanging-drop ALI after 3 (second row) and 24 (third row) hours. TEM images show several scales, from 5 μm down to 200 nm.TEM overview shows the increased prevalence of larger aggregates over time. TEM detail of larger nanostructures reveals the aggregation process. TEM detail of smaller nanostructures shows circular micelles. DLS results show the relative preponderance of nanostructures of scales from 10 to 10[thin space (1/6-em)]000 nm. The DLS measurements are qualitative, since the samples are heterogeneous and polydisperse. DLS curves are shown in triplicates, where the most representative data is drawn as a black line. 13° forward scatter DLS measurements: larger nanostructures primarily scatter light at forward angles. Therefore, we see the relative increase in micron-scale aggregates with time. 173° non-invasive back scatter DLS measurements: back scatter detection is less sensitive to the presence of large nanostructures. Therefore, we see a relatively constant signal from micelles and small self-assemblies over time. Repeating the TEM measurements by removing FBS from the cell culture medium showed a blank TEM image, where no large aggregates and mostly micelles could be seen.
To support these results, we performed dynamic light scattering (DLS) to qualify the change of the hydrodynamic radii of nanostructures at the ALI (Fig. 7; second and third columns). With the stochastic movement of aggregates in the polydisperse ALI samples and with the built-in DLS software peak smoothing, repeated measurements could not systematically find large aggregates and, therefore, DLS results should be considered qualitative. The highlighted DLS measurements confirmed an increased likelihood of uncontrolled aggregation (>1 μm) at the ALI (Fig. 7; second column) over longer periods of time and the presence of ∼20 nm nanostructures (Fig. 7; third column) throughout the experiment.
Discussion
With the experimental results displayed in Fig. 6, we validated a mathematical model of forces on polystyrene beads and cells settled at the ALI of a recirculating HDN. Here, we will elaborate on our insights in the fabrication and operation of HDNs designed for cell recirculation. We will also discuss how our results can be transferred to various applications. Finally, we will lay out the implications of our experimental observations and models on ALI modelling strategies.
Insights on fabrication and operation
The phase diagram of Fig. 5e can be used to guide system design based on the application requirements (flow or stagnation of cells). However, even for a non-optimal system, the experimental conditions can be modulated by fine-tuning the operational parameters within specific boundaries.
If cell stagnation is desired through most of the operation of the HDN, a drop aperture of 3 mm or higher is a good choice. Choosing this aperture is preferable due to stagnation being present for h/a ratios above 0.2.
If free cell flow is desired through most of the operation of the HDN, a drop aperture of 1 mm or lower is preferable. Choosing this aperture is preferable due to free flow being present for h/a ratios under 0.4.
For a precise control over cell flow or stagnation, a drop aperture around 2 mm is preferable. This aperture will offer the maximum dynamic range for cell mobility control: working with an h/a ratio between 0 and 0.3 will allow for free cell flow, and an h/a ratio between 0.3 and 0.6 will entail cell stagnation.
Our model provides valuable aids in making design considerations before the fabrication of dedicated HDNs. Careful planning along these guidelines will save time and efforts by reducing the fabrication iterations needed to finalize chip designs through trial and error.
However, even when considering all these parameters, there are challenges that apply to HDNs in general.33 From a practical standpoint, potential fabrication inconsistencies and imperfect experimental chip levelling will have effects on hanging-drop stability. First, fabrication inconsistencies, especially when aligning and bonding multiple layers, could cause drop aperture variations throughout the device. Drop aperture variations could result in a “weak link” within the network, meaning that a misshaped hanging-drop compartment with a higher drop aperture diameter could cause the corresponding liquid drop to crash down. Second, an imperfect levelling could cause a variation in the hydrostatic pressure through the chip. Since the drops are fluidically interconnected within an HDN, pressure equilibrates through all drops. The drop at the lowest level will systematically crash if its h/a ratio reaches 1. Because of such experimental considerations, we recommend limiting the maximal prescribed h/a ratio to 0.6 (black dashed line in Fig. 5e).
Impact on experimental applications
While the above listed recommendations hold for specific, established experimental conditions (8 μm diameter and 1.05 g cm−3-density particles recirculating at 1 μL min−1), our analysis can be repeated for particles of different diameters (d) and volumetric mass densities (ρ), or for different flow rates (Q). Larger particles would have a larger cross-section, leading to higher hydrodynamic forces proportional to their surface area (∝d2), increasing the force that pushes them out of the hanging drop. Larger particles, e.g., large cell aggregates or microtissues, would also have a larger volume, leading to higher gravitational forces proportional to their volumes (∝d3), pushing them to the bottom of the hanging drop. A cubic increase of gravitational forces trumps a quadratic increase of hydrodynamic forces. Therefore, an increase in particle size (for a particle with negative buoyancy) would lead to an increase in stagnation. The downstream location of the stagnation zone is constant for particles of a given size and density, subjected to a given flow rate, in a microfluidic chip of a given drop aperture (see Fig. 5d). However, increasing stagnation (Table 1 first row) would move the stagnation zone down, closer to the bottom of the hanging drop. Conversely, increasing circulation (Table 1 second row) would move the stagnation zone up, downstream in the hanging drop. Ultimately, increasing particle stagnation can be achieved by increasing particle size, particle volumetric mass density, drop height, or drop aperture, or by reducing the flow rate.
Table 1 summarizes how these various parameters affect particle stagnation and circulation. We also comment on the effort needed to change these parameters.
