Microscale impeller pump for recirculating flow in organs-on-chip and microreactors
Sophie R. Cook,1 Hannah B. Musgrove,1 Amy L. Throckmorton, Ph.D.,2 and Rebecca R. Pompano, Ph.D.1 Author information Copyright and License information PMC Disclaimer
Fluid flow is an integral part of microfluidic and organ-on-chip technology, ideally providing biomimetic fluid, cell, and nutrient exchange as well as physiological or pathological shear stress. Currently, many of the pumps that actively perfuse fluid at biomimetic flow rates are incompatible with use inside cell culture incubators, require many tubing connections, or are too large to run many devices in a confined space. To address these issues, we developed a user-friendly impeller pump that uses a 3D-printed device and impeller to recirculate fluid and cells on-chip. Impeller rotation was driven by a rotating magnetic field generated by magnets mounted on a computer fan; this pump platform required no tubing connections and could accommodate up to 36 devices at once in a standard cell culture incubator. A computational model was used to predict shear stress, velocity, and changes in pressure throughout the device. The impeller pump generated biomimetic fluid velocities (50-6400 μm/s) controllable by tuning channel and inlet dimensions and the rotational speed of the impeller, which were comparable to the order of magnitude of the velocities predicted by the computational model. Predicted shear stress was in the physiological range throughout the microchannel and over the majority of the impeller. The impeller pump successfully recirculated primary murine splenocytes for 1 hr and Jurkat T cells for 24 hr with no impact on cell viability, showing the impeller pump’s feasibility for white blood cell recirculation on-chip. In the future, we envision that this pump will be integrated into single- or multi-tissue platforms to study communication between organs.
We kindly thank the researchers at University of Virginia for this collaboration, and for sharing the results obtained with their system.

INTRODUCTION
Organ-on-chip (OOC) devices aim to mimic a tissue’s native environment by integrating single or multiple tissues in tandem into biomimetic perfusion systems.1,2 One feature that is critical to the function of these devices is directing fluid flow in a highly controlled manner. In vivo, there is constant fluid flow at varying velocities.3 Slower physiological fluid flow rates are found in the interstitium (0.1-1 μm/s)4 and within lymphatic capillaries (1.4-20.4 μm/s),5 while faster fluid flow rates are found in the blood vessel capillaries (80-180 μm/s),6 lymphatic vessels (870 μm/s, with a peak of 2200-9000 μm/s)7, veins (15,000-71,000 μm/s),8 and aortic artery (1,000,000 μm/s).9 As fluid moves, it provides nutrient and waste exchange as well as communication between organs through recirculation of cells, signaling molecules, exosomes, and so on. Flow also applies shear stress that impacts cellular function and viability and can result in cellular adhesion, activation, and extravasation.10–12 Thus, flow control systems for organs-on-chip must generate flow in a range of physiological and pathological flow rates, while ideally enabling transport of blood-borne cells between organs without damage. In addition to controllable flow rates, additional desirable qualities for flow control systems within OOC platforms include multiplexing capabilities, compatibility with cell culture incubators in terms of temperature output, and ability to recirculate media to enable cell circulation and communication between tissues.
Current technology provides a variety of methods to achieve biologically-relevant fluid flow rates on a microfluidic device, but these remain challenging for use when running many organ-on-chip devices simultaneously with fine control over flow rate, particularly for fluid recirculation. External, motorized fluid control systems such as syringe pumps13,14 and peristaltic pumps15,16 provide precise fluid control at physiological flow rates, but they can be expensive, bulky, and require many tubes or wires if running multiple devices at once. Furthermore, these pumps may emit heat, making them incompatible with use inside of an incubator for long-term culture. Recently, an elegant in-plane peristaltic pump was developed that is more compact than commercially-available peristaltic pumps and is compatible with incubators.17 With the ability to switch between multiple fluid inputs, this pump was designed primarily for rapid drug testing rather than for continuous media recirculation within OOC models. Alternatively, on-chip pneumatic peristaltic pumps use changes in pneumatic pressure to drive fluid flow, e.g. by serial compression of microfluidic channel.18–21 While powerful, this type of pump requires at least three tubing connections per device to drive fluid flow, which introduces complexity in handling for high throughput applications as well as sites for potential leaks.14,16,19–22 To avoid these issues, passive gravity-driven flow through a microfluidic device greatly simplifies handling by minimizing fluid or pneumatic connections, in exchange for less fine control over the flow rate.23–26 While most gravity-driven systems provide alternating or pulsatile unidirectional flow,23,24 cleverly-designed fluidics have also enabled continuous recirculation that is unidirectional through a single channel.25 However, actively controlled fluid recirculation for organs-on-chip remains a challenge.
A promising alternative means of active flow control uses rotating external magnets and an on-chip stir bar or impeller to drive fluid flow through a microfluidic chip.27–29 In prior reports, this approach elegantly reduced the need for tubing connections and allowed for controllable flow rates within the device.27,28,30 However, magnetic flow control has not been widely adopted, likely because the magnetic element within these devices was powered by commercially-available stir plates,27,28,30 most of which are large and lack precise rotational control or quantification. This limitation makes it challenging to run many devices simultaneously, especially within a culture incubator, and also to achieve consistent flow rates. In addition, the prior example of a rotating stir bar-based pump for OOC applications relied on manual PDMS-based fabrication and yielded a narrow range of flow rates recirculating through the device.28,30 This system was recently extended to perfuse media between two tissue models in an integrated polystyrene microfluidic plate fabricated by injection molding and laser fusion.29
Here, we present a magnetically-driven microscale impeller pump platform for recirculating fluid flow that is inexpensive, easy to fabricate and use, has low heat output, and has multiplexing capabilities. We designed and fabricated a prototype impeller pump and tested its ability to achieve a range of physiologically-relevant flow rates by varying pump and device features. We conducted computational modeling of the impeller pump geometry to assess fluid flow performance and scalar stress present within the device. As a proof-of-concept, we tested the cytocompatibility of the pump components with primary murine splenocytes and Jurkat T cells, models of recirculating white blood cells, and finally demonstrated the impeller pump’s ability to circulate cells across a range of flow rate regimes without loss of cell viability.
EXPERIMENTAL
3D-printed device fabrication
The microfluidic device and impeller piece were designed using Fusion 360. The device consisted of a large well with a micro channel loop intersecting the well tangentially. Channels had a square cross-section and were 0.5 or 1 mm in width. The microfluidic devices were printed using a CADWorks3D MiiCraft Ultra 50 DLP printer (CADWorks3D, Toronto, Canada) and a CADWorks3D MiiCraft P110Y DLP Printer (CADWorks3D, Toronto, Canada) using BV007a (MiiCraft, Jena, Germany) and Clear v.1 (FormLabs, Massachusetts, USA) resins, both recommended for use with microfluidics by their manufacturers. Designs for the device and impeller are provided in the Supporting Information. Drain ports were added in the channels when printing in the Clear resin to enable uncured resin to drain out of the channel during printing. For both resins, printer settings included a 0.10 mm gap adjustment with a slow peel speed. For BV007a in the Ultra 50 printer, a cure time of 1.15 s was used with a base cure time of 9 s for a single base layer with 1 buffer layer. All layers were printed at 50 μm and the light intensity was set to 75% power (9 mW/cm2) at 405 nm. For the P110Y printer, a cure time of 1.20 s was used with a base cure time of 25 s for a single base layer with 2 buffer layers. The light intensity was set to 100% power (5 mW/cm2) at 385 nm. For the Clear resin in the Ultra 50 printer, a 5 s cure time was used with a single base layer at a 6 s cure time, with a single buffer layer. Pieces with 1 mm channels used 50-μm layers with an 80% power setting (9.6 mW/cm2) at 405 nm; pieces with 0.5 mm channels used 100-μm layers with 75% power (9 mW/cm2) and 405 nm. For the P110Y printer, all pieces printed in the Clear resin had 100-μm layers with a 3.75 s cure time with a base cure time of 8.75 s for 4 base layers with 12 buffer layers. The light intensity was set to 70% power (3.5 mW/cm2) at 385 nm.
For the hand-washed conditions, all printed parts were rinsed with a spray bottle for 2 min with isopropyl alcohol (IPA) after coming out of the printer to remove any excess resin; parts printed in Clear resin were subsequently soaked in IPA for an additional 10 minutes. For the machine-washed conditions, all printed parts were submerged in IPA within a Form Wash (FormLabs, Massachusetts, USA) for 5 min (BV007a resin) or 8 min (Clear resin). After cleaning with alcohol, the pieces were dried thoroughly with nitrogen and placed in a high-intensity UV light box, either the CureZone (ResinWorks3D, Ontario, CA) UV light box (60 mW/cm2) or the Form Cure (FormLabs, Massachusetts, USA) UV light box (10 mW/cm2) for post curing. BV007a pieces were post-cured for 30 s in the CureZone or 1 min in the Form Cure, and Clear pieces were post-cured for 1 hour in both the CureZone or the Form Cure. After post-curing, Teflon-encapsulated magnetic stir bars (3 x 10 mm, Thomas Scientific, New Jersey, USA) were inserted into printed impeller pieces and glued in place using super glue (Loctite, Düsseldorf, Germany).
Assembly of the impeller pump external platform
Within an ABS plastic Universal Project Enclosure (200 x 120 x 56 mm, uxcell, Hong Kong, China), two 3-pin sleeve bearing computer fans (80 mm, Cooler Master, Taipei, Taiwan) were mounted on 4 screws that were glued to the base of the enclosure, termed the fan project box. Each computer fan was connected to a mini digital DC voltmeter (2.5 – 30 V, MakerFocus, Hong Kong, China) that was mounted within the enclosure so it was visible through the transparent top of the box. Two magnets were glued to the center of each computer fan. The initial prototype used 17.5 mm ceramic ferrite industrial magnets (Clout Science), which were later replaced with 6 mm brushed nickel magnets with a strength of 0.08 T (FINDMAG). The strength of the magnets used in the final prototype was measured using a Bell 610 Gaussmeter (F.W. Bell, Oregon, USA). On the outside of the fan project box, a 3D-printed chip holder (BV007a) was glued above the computer fan to hold the device in place. This project box, which resided within the cell-culture incubator during experimentation, was connected to an ABS plastic IP65 Hinged Junction box (150 x 100 x 70 mm, LMioEtool), which housed the PWM low voltage DC potentiometer (ALDECO) and 12 V DC female power connector (Chanzon), termed the power box. The power connector plugged into the 12 V AC DC power supply adapter wall plug (EWETON) that provides power to the entire pump platform. As the power project box is housed outside of the incubator, it allows for voltage and power control while an experiment is running. While the fan boxes were usually built with two fans, one pump box (Pump 7) was built with a single fan housed alongside a potentiometer; this pump box was not used for cell culture. All wiring was connected using a tin-lead rosin-core solder wire (ICESPRING) and wrapped in heat shrink tubing (Eventronic, Kommanditgesellschaft, Germany).
Assessment of the external platform
A digital laser photo tachometer (AGPtek, Brooklyn, New York, USA) was used to measure the revolutions per minute (RPM) of the magnetic impeller as it rotated. All RPMs reported were conducted at the onset of each experiment unless stated otherwise, and are the average of three RPM measurements made at a consistent voltage. The impeller pump stability was tested by measuring the impeller RPM over a period of 90 hr at a constant voltage. To monitor heat emission of the impeller pump platform, the single fan pump platform was run with no device for 24 hr in an insulated Styrofoam box at >10 V. For comparison, a peristaltic pump (BT100-1F-B, Langer Instruments, Boonton, New Jersey, USA) was run in the same box at 10 μL/min. Next, to monitor the impact of the pumps on temperature within a cell culture incubator, six external pump platforms with no devices (>10 V) were run for 24 hr in a cell culture incubator that was either off or on, as noted. Temperature was recorded from two locations inside the incubator: at the pump location (front of the top shelf) and at the back of the bottom shelf; the self-reported incubator temperature was also recorded when the incubator was on.
Computational modeling
To investigate the design of the fluid circuit, numerical modeling using computational fluid dynamics (CFD) studies was performed. ANSYS 15.0 CFX (ANSYS Inc., Canonsburg, PA, USA) was employed to mesh the geometry of the fluid circuit, including the impeller. Each fluid circuit consisted of three separate domains: 1) fluid channel; 2) top region of the pump well; and 3) the lower region of the pump well, which included the rotating impeller. Two fluid channel widths of 1 mm and 0.5 mm, with square cross-section, were considered. Each of the regions were connected via fluid-fluid interfaces. The fluid channel and top region of the pump well were specified to be in the stationary reference frame, while the lower region of the pump well with the impeller was defined to be in the rotating reference frame. A frozen rotor interface connected the top and lower regions of differing reference frames and maintained flow properties without circumferential averaging.
Each domain required separate meshes. The final mesh density for each channel width model was found using a standard grid independence study. Five separate meshes (5x10⁵, 1x10⁶, 5x10⁶, 7.5x10⁶, 10x106 element numbers), were created for each of the channel widths; the velocity values at multiple locations, pressure drop across the fluid channel, and mass flow rates in fluid channel varied by less than 5% for mesh densities greater than 5x10⁶. The final number of mesh elements for the two channel width models were 5,758,350 and 5,947,380, respectively.
A turbulence modeling approach was employed due to the strong rotational fluid dynamics in the tank reservoir and fluid velocity in the channel. All simulations were performed under steady state, with a no-slip boundary condition on surfaces and a high-resolution advection scheme. In accordance with prior profilometry measurements of 3D printed materials,31 a surface roughness was specified at 3.5 μm on the internal fluid contacting surfaces; all walls were treated as rigid. To account for the effect of surface roughness, we further utilized a k-ω turbulence model where the y+ criterion (y+ < 1) was a design requirement for the mesh construct along the surface walls. Inflation layers were utilized to ensure achievement of the mesh y+ criterion. We verified that the low-Reynolds k-ω turbulence model requirement of a y+ mesh value of less than 1 was satisfied along all of the surfaces and walls of both models. Mesh quality was confirmed using standard mesh metrics including aspect ratio, Jacobian ratio, skewness and an ANSYS metric called element quality. A hybrid mesh of tetrahedral and/or hexahedral elements defining its volume was created for each region. The grid structure was designed to satisfy standard quality metrics, including the skewness and aspect ratio.32
Mesh quality metrics for all of the models met target goals: 1) aspect ratios less than 100, 2) Jacobian ratio less than 10, 3) skewness less than 0.25 and 4) element quality measure greater than 0.75. Convergence was achieved when the residual calculation error for the state variables reached less than 10−4. In line with experimental measurements in this study, water was indicated as the fluid media with Newtonian properties of a dynamic viscosity of 0.001 kg/m*s and density of 1000 kg/m3. Rotational speeds of 500 to 900 RPM were modeled.
Simulation results were assessed qualitatively and quantitively. Pressure losses, average velocity profiles, and mass flow rates in the fluid channels were determined. Each plane for analysis was created as a cross-sectional slice of the flow domain. Scalar fluid stress was estimated using the six components of the stress tensor (Equation 1). This approach estimates the 3D flow field and calculates a scalar stress (σ) as representative of the level of stress experienced by the fluid traveling through the entire model.33,34
Experimental fluid flow characterization
To measure the maximum velocity of the fluid flow within the device, a drop of blue food coloring (McCormick Culinary Food Color) was inserted into a reservoir in the device and tracked using a Dino-Lite Edge 3.0 digital microscope (SunriseDino, Torrance, CA, USA). Images were collected over time, and the distance the food coloring front moved over time was measured using DinoXcope software (SunriseDino, Torrance, CA, USA) to determine the fluid velocity. In preliminary experiments, we found that in situ measurement was preferable to addition of an external in-line flow meter, as the latter offered too high of a flow resistance and slowed the flow rate through the device.
For the experiments comparing channel size, the BV007a resin was used and the devices were printed using the MiiCraft Ultra 50 printer, hand washed, and cured in the CureZone. We later acquired a new, higher capacity printer and automated washer, which were used for subsequent experiments. Therefore, when comparing the changes in inlet size, the devices were printed using BV007a resin on the MiiCraft P110Y printer, washed using the Form Wash, and cured using the Form Cure.
The flow resistance (R) in each condition was calculated via an approximation for resistance in a square channel, where η is viscosity, L is channel length, and w is channel width (Equation 2):35

Primary murine splenocyte preparation
All animal work was approved by the Institutional Animal Care and Use Committee at the University of Virginia under protocol #4042, and was conducted in compliance with guidelines from the University of Virginia Animal Care and Use Committee and the Office of Laboratory Animal Welfare at the National Institutes of Health (United States). Spleens were harvested from female and male C57BL/6 mice (Jackson Laboratory, USA) under the age of 6 months following isoflurane anesthesia and cervical dislocation. The spleens were collected into “complete RPMI” media consisting of RPMI (Lonza, Walkersville, MD, USA) supplemented with 10% FBS (VWR, Seradigm USDA approved, Radnor, PA, USA), 1× l-glutamine (Gibco Life Technologies, Gaithersburg, MD, USA), 50 U/mL Pen/Strep (Gibco, MD, USA), 50 μM beta-mercaptoethanol (Gibco, MD, USA), 1 mM sodium pyruvate (Hyclone, Logan, UT, USA), 1× non-essential amino acids (Hyclone, UT, USA), and 20 mM HEPES (VWR, PA, USA). Spleens were crushed through a 70-μm Nylon mesh filter (Thermo Fisher, Pittsburgh, PA, USA) with 10 mL of complete media, then centrifuged for 5 minutes at 400 x g. To lyse red blood cells, the pellet was resuspended in 2 mL of ACK lysis buffer prepared from 4.15 g NH4Cl (Sigma-Aldrich, St. Louis, MO, USA), 0.5 g KHCO4 (Sigma, MO, USA), and 18.7 g Na2EDTA (Sigma, MO, USA) in 0.5 L MilliQ water (Millipore Sigma, Burlington, MA, USA). Cells were lysed for 1 minute, then quenched with 10 mL of complete media, and centrifuged again. The pellet was resuspended in complete media, producing a splenocyte suspension with the density determined by trypan blue exclusion. The suspensions were diluted with complete media to a concentration of 1 x 10⁶ cells/mL in preparation for culture.
Jurkat T cell preparation
For 24 hr long culture on 3D-printed devices, human Jurkat T lymphoblast cells (Clone E6-1 TIB-152, ATCC, VA, USA) were obtained from the laboratory of Ken Hsu at the University of Virginia. The cell line was cultured in media consisting of RPMI (Lonza, Walkersville, MD, USA) supplemented with 10% FBS (VWR, Seradigm USDA approved, Radnor, PA, USA), 1× l-glutamine (Gibco Life Technologies, Gaithersburg, MD, USA) and 50 U/mL Pen/Strep (Gibco, MD, USA). Before on-chip culture, the cells were centrifuged at 200 x g for 5 min and resuspended in 10 mL of media, producing a cell suspension whose density was determined by trypan blue exclusion. The suspensions were diluted with additional media to a density of 0.8 – 1 x 10⁶ cells/mL in preparation for culture.
Analysis of cell viability
Prior to culture, all prints were post-treated as outlined above, and then subjected to an additional leaching process. For initial 1- and 4-hr tests of resin cytotoxicity and pump biocompatibility, the prints were soaked in 1x PBS (Lonza, MD, USA) for 24 hr at 37°C (BV007a prints) or 70°C (Clear prints) to mitigate cytotoxicity.36 Primary splenocytes (3.5 mL, 106 cells/mL in complete media) were aliquoted into the pump well of a 3D printed device or into a 12-well polystyrene non-treated tissue culture plate (VWR, Radnor, PA, USA) that served as a control. The wells within the tissue culture plate (23 mm diameter) were similar in diameter to the 3D printed pump wells (26 mm diameter), and the volume of media used was the same, so oxygenation and dilution of secreted factors is expected to be similar in the two systems. Cells were cultured at 37°C with 5% CO2 for either 4 hours for material cytotoxicity testing or 1 hour for “pump-on” viability testing.
In preparation for 24-hr cell culture on Clear prints, a longer leach step was performed, in which the devices were soaked in 1x PBS for 8 days and in complete media for 2 days at 37°C.37 Jurkat T cells or primary murine splenocytes were cultured within the printed and leached devices. The Jurkat cells and splenocytes (3.5 mL, 106 cells/mL in Jurkat-specific media) were aliquoted into the pump well of a 3D printed device or into a 12-well polystyrene non-treated tissue culture plate (VWR, Radnor, PA, USA) as a control. The cells were cultured at 37°C with 5% CO2 for 24 hr.
Following the culture period, the cell viability was assessed by flow cytometry using a previously established protocol.38 Briefly, 500 μL samples at 106 cells/mL were stained with Calcein AM (eBioscience, San Diego, CA, USA) at 67 nM for splenocytes and 95 nM for Jurkat T cells in 1x PBS for 20 minutes at 37°C. The stained samples were washed by centrifugation at 400 x g for splenocytes and 200 x g for Jurkat T cells for 5 min, then resuspended in flow buffer (1x PBS with 2% FBS). Following the wash step, 4 μL of 1 mg/mL 7-AAD (AAT Bioquest, Sunnyvale, CA, USA) was added to the cell suspension. Single-stain compensation controls were prepared using plate control cells (Calcein AM) or cells treated with a 1:1 v/v mix of media and 70% ethanol for 20 minutes (7-AAD); single-stains were mixed 1:1 v/v with unstained cells for analysis. All samples and controls were run on a Guava 4-color cytometer (6-2L) and analyzed with Guava® InCyte™ Software. 7-AADlow was defined as Live, and 7-AADhigh was defined as Dead.
The shear stress for each condition was approximated by calculating the fluid shear stress (FSS), where η is viscosity, Q is volumetric flow rate, h is channel height, and w is channel width (Equation 2).39

Imaging cell recirculation on-chip
Primary splenocytes were suspended at 3x10⁶ cells/mL in 1x PBS and labelled with 3 μM Calcein AM for 20 minutes at 37°C. The labelled samples were washed by centrifugation at 400 x g for 5 min, then resuspended in 1x PBS at 3x10⁶ cells/mL. Cell circulation was monitored in real time using a Zeiss AxioZoom macroscope (Carl Zeiss Microscopy, Germany) with an Axiocam 506 Mono camera and a filter cube for GFP (Zeiss filter set #38). 300 μL of the cell suspension was pipetted into the pump well of a 1x PBS-filled device, with the impeller off. After 15 minutes, initial images were captured within the pump well and near the reservoir in the channel. The pump was then turned on (~6.20 V), and images were captured of cells moving through the channel and reservoir.
RESULTS AND DISCUSSION
Concept of the microscale impeller pump
When designing the impeller pump platform, the major design goals included 1) small overall size, 2) user-friendly interface, 3) easily expandable to run multiple devices at once, 4) low heat output to be compatible with use inside cell culture incubators, and 5) ability to achieve controllable recirculating fluid flow at physiologically relevant flow rates. To address many of these design goals, we selected a fluid pumping mechanism inspired by that of the centrifugal water pump.40 The centrifugal water pump consists of a circular chamber with a rotary impeller that has curved vanes to generate a suction force, converting rotational energy into hydrodynamic energy and inducing fluid flow. Historically, large-scale centrifugal pumps were designed to recirculate and oxygenate water for fish and live bait on a fishing boat, similar to the purpose of media perfusion on a microfluidic device.40 This design and related waterwheel-based systems have been integrated into smaller-scale pumps for use as an artificial heart pump41 as well as in microfluidic technology.27,28,30,42–44
To adapt the centrifugal pump design to be compatible with recirculating fluid flow in a microfluidic device, spinning magnets were used to drive impeller rotation. Unlike rotating the impeller using an external motor, the use of a rotating magnetic field to drive fluid flow resulted in a simple set-up that was readily compatible with microfabrication techniques. The magnetic impeller rested within a large fluid-filled well, similar to the main chamber in a centrifugal water pump, and its rotation was used to drive fluid recirculation through an attached microchannel loop (Figure 1). Consistent with the vorticity of the impeller-driven flow in the well, preliminary tests showed that a tangential intersection provided better flow of fluid into the channel loop than a perpendicular intersection (data not shown). The direction of the recirculating fluid flow was determined by the rotational direction of the magnetic impeller (Figure S1), which in turn is controlled by the direction of the rotating magnets on the external pump platform.
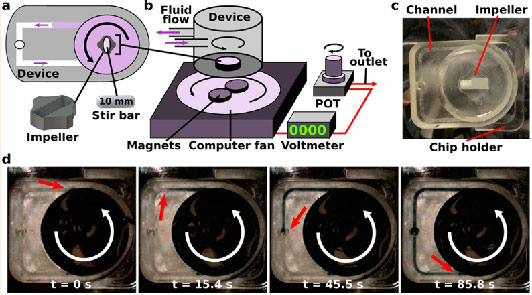
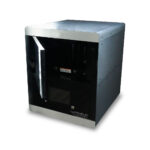
Figure 1 . Design and prototype of the impeller pump and external pump platform.
(a) The impeller pump consisted of a magnetic stir bar inserted into a 3D-printed impeller placed within a large well on a 3D-printed microfluidic device. (b) The device was placed on top of an external pump platform, where the rotation of magnets on a computer fan caused the impeller to rotate, moving fluid through the device. The computer fan voltage was controlled using a potentiometer (POT), with voltage readout from a voltmeter. (c) An image of the device in place on the external pump platform. A reflective material was placed on half of the impeller piece to allow for RPM detection using a digital laser photo tachometer. Channel width was 1 mm. (d) Time-lapse images of recirculating fluid flow. The impeller rotated counter-clockwise (white arrow). Blue dye was inserted into the pump well, and over time, the dye exited the well and traveled through the channel (dye front marked with red arrow). Channel width was 1 mm.
Design and fabrication of 3D-printed microfluidic device and impeller insert
To generate a microscale impeller pump for use with microfluidic technology, digital light processing (DLP) 3D printing was used to generate the microdevice and impeller-like part (Figure 1c). DLP 3D printing produces highly reproducible devices in a shorter timescale than traditional soft lithography, and the open-source nature of this fabrication allows for easy translation to collaborators.45,46 Furthermore, this fabrication technique provided access to the required complex architecture, which would be challenging to produce by standard planar fabrication methods. To test the pump, we fabricated a simple chip that contained a large well that was connected to a loop of internal microchannels for recirculating fluid flow (Figure 1a,,c).c). To modulate the flow resistance through the microchannel and thus access a wide range of flow rates driven by the impeller pump, we designed two versions of the device with 0.5-mm or 1-mm square channel dimensions. Optically transparent resins were selected to facilitate imaging of flow through the microchannel (Figure 1d). Each device print took only 1 hr with an overall materials cost of $1-3 per device, making it easy and relatively inexpensive to produce a large number of chips for experiments. The impeller took 15 min to print at a materials cost of $0.03-0.12 per impeller, and was designed to hold a 10 mm magnetic stir bar in a rectangular hole in its center (Figure 1a).
When designing the dimensions of the pump well, impeller, and entry points of the microchannel, we reasoned that the hydrodynamic energy produced in the pump well by the rotating impeller would decrease further from the impeller, due to viscous energy losses. Consistent with this principle, in preliminary work, we found that if the impeller filled the majority of the cross-sectional area of the well, then the hydrodynamic energy generated fluid velocities that were able to reach as high as 33,000 μm/s (Figure S2), sufficient to model venous or arterial fluid flow.8,9 As we were primarily interested in slower capillary and lymphatic vessel flow velocities, a low impeller/well ratio was chosen, with a large well diameter (26 mm) relative to the smaller impeller piece (11.5 mm). Similarly, the intersection height of the channels approximately two-thirds up the side of the well (8.5 mm from the base of a 12-mm deep well) was optimized to slow the flow rates through the corresponding channel compared to a lower intersection height (Figure S2). In this manner, a 3-dimensional architecture for the device and impeller was achieved and optimized through rapid 3D printing, enabling the pump to attain biologically-relevant fluid flow regimes.
Design and fabrication of the external pump platform
The primary purpose of the external pump platform was to rotate magnets at a controlled and user-selectable rotational speed. Initially, we used a small DC motor that rotated two magnets with an Arduino board to control the rotational speed. However, we found that the DC motor emitted heat over time (data not shown), so we replaced it with a computer fan, which we hypothesized would emit less heat. The two magnets were glued to the center of the fan to control the rotation of the impeller within the microfluidic device (Figure 1b, ,2a).2a). For simplicity, a DC power adaptor was used that could be plugged into a wall outlet, and a potentiometer (POT) and voltmeter were used to provide voltage control and readout, respectively. The use of a POT and voltmeter minimized the complexity of the pump by removing the need for pump-computer interfacing to select the speeds, and allowed for the external platform to be condensed into a small overall size. To use the pump platform in a humidified incubator, the electronics needed to be sealed within an air-tight enclosure to prevent damage from the water vapor. As a result, the computer fan, POT, and voltmeter were mounted within an air-tight plastic project box (Figure 2a). No fluidic or pneumatic tubing was required for pump function in this device, which resulted in a pump platform that was easy to use that avoids leaks and further complications. Furthermore, the use of common, inexpensive items such as small magnetic stirrers and computer fans resulted in an overall materials cost of $50-75, and it took approximately 2 hr to assemble each pump platform. These qualities made the external impeller pump platform easy to replicate to be able to run many devices simultaneously.
Figure 2. Impeller pump control and external platform expansion..
(a) An image of an external pump platform with a single computer fan in a project box with a single voltmeter and POT. (b) As the voltage increased, the RPMs increased for pumps 1-7. The black line represents the line of best fit for the entire data set (y = 281(x) - 1221, R2 = 0.9522). (c) Impeller RPM was measured at three voltages in devices with varied channel dimensions. Results were compared using a one-way ANOVA (n = 3); ns indicates p > 0.9. (d) The distance between the center of the magnets dictated the stability of the magnetic stirrer within the impeller. When the distance (d1) was greater than the length of the stirrer, the impeller rotation is unstable, resulting in no fluid flow. When the distance (d2) was equal to the length of the stirrer, the impeller rotation was stable. (e) Stability of impeller rotation speed over a period of 90 hr. (f) An image of the multiplexed external pump platform with two computer fans per project box, each with their respective voltmeter. Each fan was connected to an individual POT, which were all housed in a shared hinged project box. (g) Six devices placed on a single shelf of a cell culture incubator.
Finally, to secure the location of the device relative to the location of the spinning magnets, a 3D-printed chip holder was designed and mounted on the top of the project box (Figure 1c). The holder was positioned such that the center of the pump well was aligned over the spinning magnets, thus ensuring stable impeller rotation. The height of the fan and magnet assembly was also fixed relative to the chip holder, thus ensuring consistent magnetic engagement.
Tunability and stability of impeller rotation
We tested the ability to control the speed of impeller rotation by tuning the voltage provided by the potentiometer to the computer fan. A digital laser photo tachometer was used to measure the rotations per minute (RPM) of the impeller by placing a reflective material across half of the impeller (Figure 1c). As the impeller rotated within a water-filled well, the tachometer counted the number of times the reflective material passed through the laser emitted and provided a numerical value of the RPMs. As expected, the speed of rotation increased linearly with the voltage each computer fan received, which was read out using the voltmeter within the external pump platform (Figure 2b). There were variations between the RPMs across seven copies of the pump platform (root-mean-square deviation from line of best fit = 89 RPM), perhaps due to differences in the response of the computer fans to voltage supply. Since this variation was minor, the pump platforms were treated as equivalent. As expected, there was not a significant difference in impeller RPM when used in microchips with different channel dimensions at the same voltage (Figure 2c).
As the impeller rotated within the pump well, a vortex of fluid was generated to drive fluid through the channel. In an initial design with large magnets, we observed that unstable impeller rotation failed to form a fluidic vortex and did not drive stable fluid flow (illustrated in Figure 2d). In this design, the distance between the center points of the magnets (d1 = 17.5 mm) was greater than the length of the 10 mm stir bar. To resolve this issue, smaller magnets were used to matched the center-to-center distance to the length of the stir bar (d2 = 10 mm) (Figure 2d).47 With this design, impeller rotation was stable for at least 90 hr (Figure 2e). The steady computer fan rotation provided nonpulsatile unidirectional fluid flow by design; if pulsatile or bidirectional fluid flow were desired, additional electronics such as Arduino could be added to modulate the voltage the computer fan receives, or a bi-directional, low-heat motor could be used instead of the fan.
Scale up to a multiplexed pump platform
The impeller pump was designed to be used with OOCs, for which simultaneous use of many devices is crucial to reduce the experiment time and increase the power of biological experiments. Therefore, we tested the scale up of the external platform to run multiple micropumps simultaneously. To scale up the prototype external platform, two computer fans were mounted within a single project box. This design was easily scaled up by producing 3 project boxes (Figure 2f) to run 6 devices on a single shelf of a cell culture incubator (Figure 2g), with total space for up to 36 devices (18 boxes) in the incubator if needed. In the future, use of smaller fans or low-heat motors may enable further miniaturization of the pump platform to fit additional pumps into the incubator, but this was not explored here. We chose a design in which each computer fan was individually connected to a potentiometer so that each fan could run at different speeds. The potentiometers for all six fans were kept in a separate hinged project box that remained outside of the cell culture incubator to increase the available space within the incubator (Figure 2g). This feature also reduced the potential for damage of the electrical parts at 37 °C and high humidity. For simplicity, the entire multiplexed system shared a single power adapter, with the voltage split between each fan.
Finally, we tested the variation in impeller rotation across all six of the external pump platforms. Similar to the slight variation in the resulting RPMs at different voltages (Figure 2b), we observed variation (26% CV) in the measured fluid velocity at a fixed voltage between copies of the hand-built external pump platform (Figure S4). We anticipate that in experiments where accuracy of flow rate is critical, each pump platform will be screened in a quality control step to verify that it provides flow in a specified range. Alternatively, in the future, automation of production of the platforms would likely reduce variation.
Negligible heat emission for long-term culture
A major design goal for the impeller pump was minimal heat emission to allow for extended cell culture within an incubator. Stable temperatures (±1°C) are critical to maintain viable cell cultures,48 and we previously found that a peristaltic pump rapidly raised the temperature inside a culture incubator if not countered with cooling packs.16 To test this feature of the impeller pump, the heat emission was first measured by placing the pump platform at a high rotational speed (> 10 V) or a peristaltic pump at 10 μL/min within an insulated Styrofoam box for 24 hr (Figure 3a). After 24 hr, the temperature within the box had increased modestly to 29.0°C with the impeller pump (temperature with no pump, 21.0°C), versus a drastic increase to 52.7°C with the peristaltic pump (Figure 3a).s simultaneously.
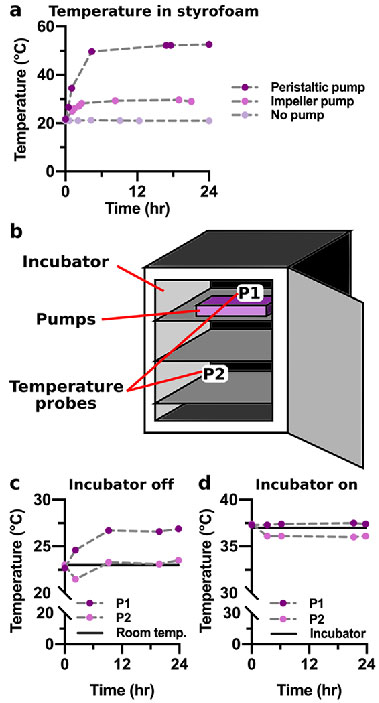
Figure 3. Heat emission of the impeller pump
(a) The temperature within a closed Styrofoam box was measured with no pump, a single impeller pump platform (>10 V), and a peristaltic pump (10 μL/min) over a period of 24 hr. (b) A schematic of a cell culture incubator during the experiment. When measuring the temperature within the incubator, the six pumps were placed on the front of the top shelf to the right. The temperature was measured at the pumps on the top shelf to the right (P1) as well as in the back of the bottom shelf to the left (P2). (c,d) The temperature within a cell culture incubator was measured at positions P1 and P2 while six pumps were run (>10 V) over a period of 24 hr while the incubator was (c) off or (d) on. Black lines indicate room temperature (c) and the temperature readout from the incubator when it was on (d). (Single column)
As the pumps will primarily be used within cell culture incubators, we also tested how use of the impeller pump affected the internal temperature of an enclosed incubator. For a rigorous test, we ran six pump platforms simultaneously at a high rotational speed (>10 V) for 24 hr in the incubator. When this test was conducted with the incubator shut down, i.e. without any built-in temperature control, there was a 4°C increase in temperature near the pumps (P1), while the temperature far from the pumps remained comparable to room temperature (P2) (Figure 3b,,c).c). Conducting the same test with the incubator on, i.e. to replicate cell culture circumstances, resulted in only a 0.4°C increase at the pumps (P1), which is within the ±1°C acceptable temperature window,48 and the temperature far from the pumps remained relatively constant (Figure 3d). Furthermore, there was no change in the temperature reported by the cell culture incubator (37.0°C), whose sensor is located near the pumps at the top of the incubator. Collectively, these data indicated that the multiplexed external pump platform did not emit a noticeable amount of heat and was compatible with extended use inside a cell culture incubator.48
Predicted fluid flow using a computational model of the impeller pump and microfluidic chip.
To model the low (~10-100 μm/s)6 and high (1-10 mm/s)7 fluid velocities found within blood and lymphatic vessels, the impeller pump platform must be able to control the flow rate over several orders of magnitude. To understand the factors that controlled impeller-driven fluid flow through the microfluidic device, a computational model was developed (Figure 4a). The frozen rotor method was used to model the spinning impeller,41 with one rotating domain and one stationary domain to avoid discontinuities at the entry to the microchannel. The stationary domain consisted of the top of the pump well and the connecting channel (Figure 4bi), while the rotating domain consisted of the base of the pump well and the impeller piece (Figure 4bii). The mesh density for each fluid domain was determined using a grid independence study to elucidate when the physics being modeled was no longer dependent upon the mesh resolution (see Experimental). Briefly, to establish mesh independence for each channel geometry, we examined value fluctuations for key study parameters: pressure drop across the channel, mass flow rate in the channel, and fluid velocities on the channel inflow and outflow. The analysis revealed higher value fluctuations (7.6-15.3%) for coarser densities and then leveled to fluctuations of less than 5% for mesh sizes greater than 5 million elements (Figure 4b). A turbulence modeling approach was employed due to the strong rotational fluid dynamics in the tank reservoir and fluid velocity in the channel. To account for the effect of surface roughness, a low-Reynolds k-ω turbulence model was adopted (see Experimental). The y+ turbulence mesh parameter was also verified. Mesh quality was confirmed using standard mesh metrics (i.e., aspect ratio, skewness, element quality).
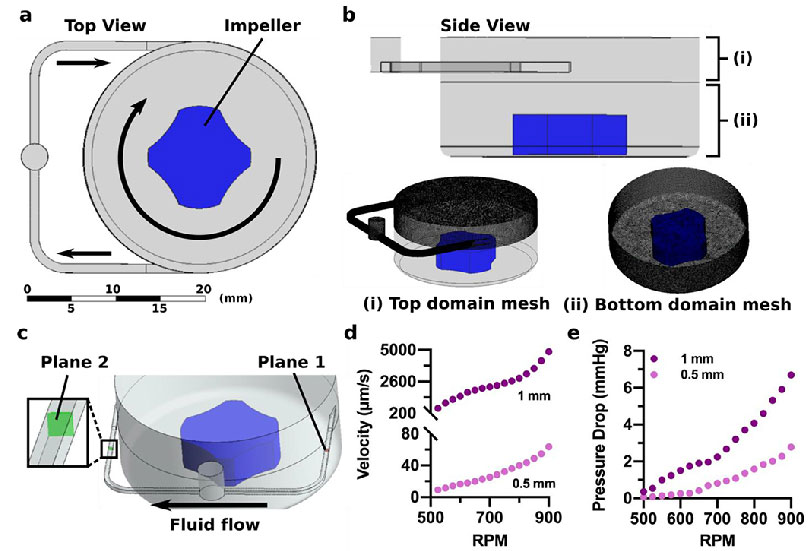
Figure 4. Simulated flow control with the microscale impeller pump.
(a) Top view of the fluid circuit model showing the narrow fluid channel, the impeller, and the pump well. Arrows show direction of fluid flow. (b) Side view of the fluid circuit model showing the (i) top domain mesh that contained the top of the pump well and connecting channel and (ii) the bottom domain mesh that contained the lower region of the pump well and the rotating impeller. (c) As the impeller rotated in the simulation, fluid left the pump well and crossed Plane 1, passed through the remaining channel domain, and crossed Plane 2 prior to re-entering the pump well. Flow rate and pressure drops were determined at these two locations. (d) Predicted average velocity across plane 1 and (e) predicted pressure loss between plane 1 and 2 increased with the RPM of the impeller, for both the 0.5 mm and 1 mm channel size.
The computational model was used to predict the trends in velocity and the pressure drop across a transverse plane in the microfluidic channel as a function of these parameters (Figure 4c). As expected, increased rotational speed of the impeller drove increased rates of flow through the microchannels, and the larger channel size resulted in higher average velocities (580-4900 μm/s) than the smaller channel size (9-64 μm/s) (Figure 4d).6,7 There was a more substantial pressure drop for the 1 mm channel, as compared to the 0.5 mm channel (Figure 4e); while initially counter-intuitive, this result is consistent with Hagen-Poiseuille’s law, as the increase in velocity for a larger channel size exceeded the decrease in flow resistance. Thus, these computational findings demonstrated that the flow regime can be selected by altering microfluidic circuit geometry and fine-tuned by varying the RPM.
Experimental fluid velocity control over two orders of magnitude
After the computational model was used to predict trends in velocity within the device, we proceeded to experimentally evaluate the velocity in the prototype experimental system across a variety of different conditions. To measure the velocity within the 3D-printed device, reservoirs were added near the pump well for dye insertion. An equilibration period was needed to achieve a consistent velocity after initially starting the impeller rotation, which was observed to be approximately 3-5 minutes. After this time, a drop of dye was inserted into the reservoir, and images were collected as the front of dye moved over time (Figure 5a). The maximum velocity was measured at the center point of the parabolic flow of the moving front of dye within the channels (Figure S3, ,5a).5a). This in situ measurement method ensured that no additional pressure drop was introduced by adding an external flow rate sensor.
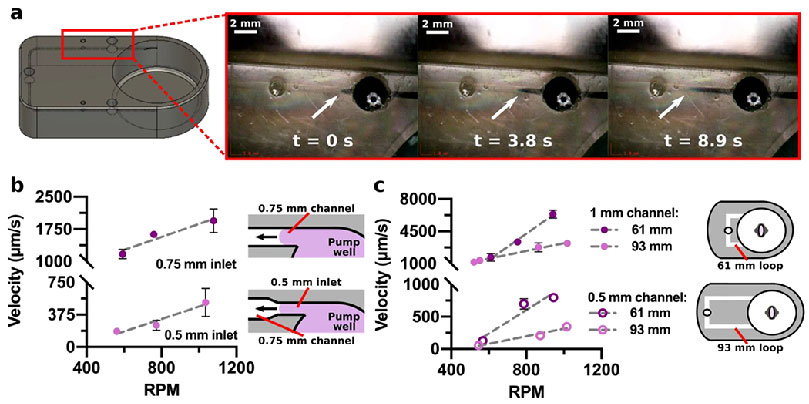
Figure 5. Experimental flow control with the microscale impeller pump.
(a) 3D rendering and photos of a 3D printed device (0.5 mm channel size), showing colored dye moving through the channel over time. The white arrow corresponds to the dye front as it moves away from the reservoir over time. (b) Experimentally measured maximum velocity in a 0.75-mm channel without a constriction (0.75-mm inlet; n = 3) and with a constriction (0.5-mm inlet; n = 3) increased as RPM increased. The constriction occupied 16% of the 91-mm total channel length. (c) Experimentally measured maximum velocity in 0.5- or 1-mm channels with varied channel length. (n = 3, except for 1 mm, 93 mm long channel where n = 4).
We reasoned that as the impeller circulated fluid within the well, a portion of the rotating fluid was pushed through the intersecting channel inlet, driving fluid into the channel. Therefore, the volumetric flow rate (mass flow) at the channel inlet should be driven by both the rotational velocity and the cross-sectional area of the entryway to the channel, with a larger cross-sectional area allowing more fluid entry. As expected, and consistent with the simulated data, the velocity within the channels increased with the rotational speed of the impeller (Figure 5b,,c).c). To test the effect of the entry area on flow rate, the inlet size was varied while keeping the cross-sectional area of the downstream channel (square cross-section) the same. Interestingly, constricting the inlet from 0.75 mm square (11.8 Pa*s/mm3 flow resistance) to 0.5 mm square (19.8 Pa*s/mm3) decreased the velocity measured in the channel downstream by over 6-fold (Figure 5b), despite the channel itself retaining the same dimensions. As the short constriction only increases flow resistance by < 2-fold, the increased resistance cannot fully account for the significant drop in velocity, so we predict that the reduced inlet area also played a role. The dependence on the cross-sectional area of the entry point in this open system is different from the behavior of pressure-driven flow in a fully closed system, which must maintain a constant volumetric flow rate.
Next, we explicitly tested the prediction that increasing the resistance within the microfluidic loop, e.g. with longer or narrower channels, would result in a lower velocity regime. The larger channel width, 1 mm (2.5 Pa*s/mm3), resulted in a higher velocity range (1680-6400 μm/s at 61 mm) that was comparable to lymphatic vessels in vivo (Figure 5c).7 Reducing the channel width to 0.5 mm (39.8 Pa*s/mm3) yielded a lower velocity range (130-800 μm/s at 61 mm) that was comparable to blood vessel capillaries in vivo (Figure 5c).6 This trend matched that of the computational model and combines an increase in flow resistance with a decrease in entry area. Lengthening the total channel from 61 mm to 93 mm (60.5 Pa*s/mm3 for 0.5 mm channel, 3.8 Pa*s/mm3 for 1 mm channel), which changes flow resistance alone, resulted in a slower velocity as expected, though interestingly only for higher impeller rotational speeds (Figure 5c), again potentially attributable to the open system.
These results confirm that changes in the resistance of the microfluidic network impact the velocity of impeller-driven flow, and also indicate that experimental calibration of flow rate versus impeller rotation speed must be performed for each microdevice design. While the experimental trends were similar to the computational model, the magnitudes of the experimental and predicted velocities differed quantitatively, especially for the smaller channel size. We speculate that the experimental system is subject to additional forces not yet captured by the model, such as the generation of vortex flow within the pump well upon impeller rotation,49 surface tension and wetting at the air-water interface in the pump well, varied surface roughness, and small variations in channel dimensions. While the model will be further refined in the future, changes in resins, print quality, and device architecture also would be expected to impact difficult-to-control parameters such as surface roughness and shrinkage, which alter the precise dimensions of the channels. Therefore, calibration of the velocity across a range of impeller rotational speeds should be performed for quantitative flow rate control, similar to calibration of peristaltic pumps.
Shear stress approximation across device
Having validated the trends of the computational model, we used it to predict the levels of shear stress within the device during impeller-driven fluid flow. Shear stress is a major consideration for cell recirculation, as high shear stress can damage the cells and diminish viability. Physiological shear stress spans 0.6-12 dyn/cm2 in lymphatic vessels and 0.35-70 dyn/cm2 in normal blood vasculature.7,50 100 dyne/cm2 is sometimes considered the threshold for pathological shear, which reaches >1500 dyn/cm2 in diseased or stenotic vessels.50 Using the computational model, fluid shear stress levels during high impeller rotational speeds (900 RPM) were estimated at various regions within the device. Looking at the impeller surface, 93.2% of the surface was < 100 dynes/cm2 (Figure 6a), i.e. within the physiological range. The highest shear stress, 400 dynes/cm2, was found along the edges of the impeller; we reasoned that the cells suspended in the circulating media would rarely contact the impeller surface or edges due to centrifugal forces and the large volume of the pump well. Within the channels, the surface shear stress approximations were much lower and well within the physiological range: 0.04-0.10 dynes/cm2 in the 0.5 mm channel (Figure 6b), and 0.40-1.22 dynes/cm2 in the 1 mm channel (Figure 6c), with the highest stress in the corners of the channel. Based off of these results, we predicted that the impeller rotation would not have a significant impact on the viability of circulating cells.

Figure 6. Predicted shear stress within the device.
The scalar stress was approximated using the computational model across the surface of (a) the impeller, (b) the 0.5 mm channel, (c) and the 1 mm channel. (a) Along the impeller, the highest scalar stress was present along the edges. (b,c) The scalar stress was highest at the corners of the channel in both channel designs. (Single column)
Selection of a sufficiently biocompatible resin for the 3D-printed micropump
As the impeller pump platform is intended to recirculate fluid and cells within OOCs and other biological model systems, the material used to fabricate the device and impeller must be cytocompatible for the timescale of the experiment. While 3D printing is an easy way to reproducibly fabricate microfluidic devices with complex architecture in a short period of time, the liquid photopolymer resins used for stereolithography (SLA) and digital light processing (DLP) 3D printing are often cytotoxic.51 The use of additives such as optical absorbers and plasticizers can enhance the print resolution, enabling smaller internal channel sizes and smaller port diameters, such as with the MiiCraft BV007a resin, but these may result in increased toxicity if these molecules leach out of the device.36,51–53 Some photopolymer resins designed for biomedical applications, such as FormLabs Clear, may have reduced cytotoxic additives but also reduced print resolution.53
To identify a cytocompatible resin for the microscale impeller pump, the device and impeller were printed in two different resins, MiiCraft BV007a and FormLabs Clear (Figure 7a), and tested with primary murine splenocytes as a model for circulating white blood cells. Primary splenocytes provided a rigorous cytotoxicity test because they are more susceptible to damage than immortalized cell lines. To remove cytotoxic leachates, the BV007a and Clear devices were soaked in PBS for 24 hr at 37°C and 70°C, respectively (“post-treatment”) prior to use.36,53 After 4 hr of culture in complete media in the pump well without impeller rotation, primary splenocytes cultured on the BV007a piece had significantly decreased viability compared to off-chip controls, with less than 30% viable cells (Figure 7b, Figure S5). In contrast, culture on the Clear piece yielded no significant difference in viability compared to the off-chip controls, though there was a non-significant drop (Figure 7b).
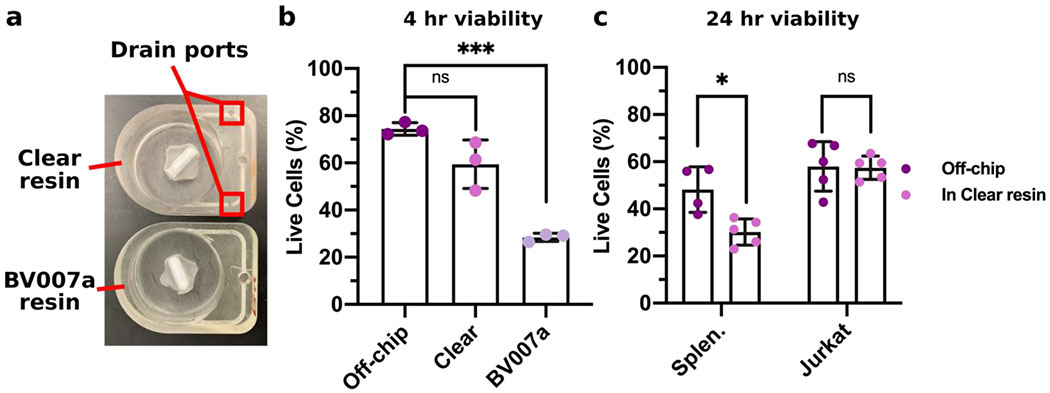
Figure 7. Assessment of the biocompatibility of 3D-printed pump chambers with primary splenocytes and an immortalized lymphocyte cell line.
(a) Image of devices printed in the Clear resin and BV007a resin for cytotoxicity testing. The device printed in the Clear resin required drain ports along the channel to print internal channels. (b) Primary splenocytes were cultured for 4 hr without impeller rotation in devices post-treated with a 24 hr soak, and viability was analyzed by flow cytometry. Quantification of live (7-AADlow) cells after culture off-chip, in the Clear pump well, or in the BV007a pump well. Results were compared using a one-way ANOVA with Tukey post-hoc tests (n = 3). *** indicates p <0.0006; ns indicates p > 0.08. (c) Primary splenocytes (Splen.) and Jurkat T cells were cultured for 24 hr without impeller rotation in devices printed using the Clear resin with a 10-day post-treatment ,and viability was analyzed by flow cytometry. Quantification of live (7-AADlow) cells after culture both off-chip and in resin for both cell types. Results were compared using a one-way ANOVA with Tukey post-hoc tests (n = 5, except for off-chip splenocytes where n = 4). * indicates p < 0.02; ns indicates p > 0.2.
Having identified the Clear resin as the more promising material, we further tested it for overnight cell culture using primary and immortalized cells, since the latter are more hardy. To ensure that all possible leachates were removed, devices printed in the Clear resin were soaked in PBS for 8 days and then in media for 2 days at 37°C, according to a published protocol.37 Primary murine splenocytes and Jurkat T cells were cultured within the 3D-printed microfluidic pump wells for 24 hr without impeller rotation. Whereas primary splenocytes showed a significant decrease in viability, the viability of Jurkat T cells was not significantly different compared to off-chip controls (Figure 7c). Therefore, we concluded that the Clear resin was sufficiently compatible for use in experiments of 4 hr or shorter duration with primary cells, and that the use of cell lines expanded compatibility to at least 24 hr. Biocompatibility of SLA/DLP resins for primary cell culture continues to be an area of investigation in our lab and others.
Recirculation of lymphocytes under biomimetic flow regimes
Cell recirculation is a key feature of inter-organ communication in vivo, and a new pump for organs on chip should be able to drive cell recirculation without impairing viability. Here, we tested the ability of the impeller pump to drive continuous white blood cell recirculation under fluid velocities found within lymphatic vessels and vasculature in vivo. Given the depth and size of the pump well, it was possible that cells would settle to the bottom of the pump well instead of remaining suspended for recirculation through the microfluidic channel, especially at low RPM. To address this concern, primary splenocytes were stained with Calcein AM and deliberately allowed to settle to the base of the pump well of a pre-filled device while the impeller was off (Figure 8a). Imaging at this time confirmed that the cells settled along the base of the pump well (Figure 8b) and that no cells were present within the channels (Figure 8c). Once the impeller began to rotate at a low rotational speed (6.20 V, 420 RPM), the cells resting on the base of the pump well were resuspended and began to recirculate through the channels, where they were visible entering the reservoir (Figure 8d). Cells moved much faster through the 1-mm channel, as evidenced by the blurring of fluorescently-labeled cells moving through the center of the reservoir, than through the 0.5 mm channel, consistent with the slower flow rate in narrower channels (Figure 8d). Thus, the rotation of the impeller pump successfully resuspended cells even from rest and achieved continuous cell recirculation through the device.
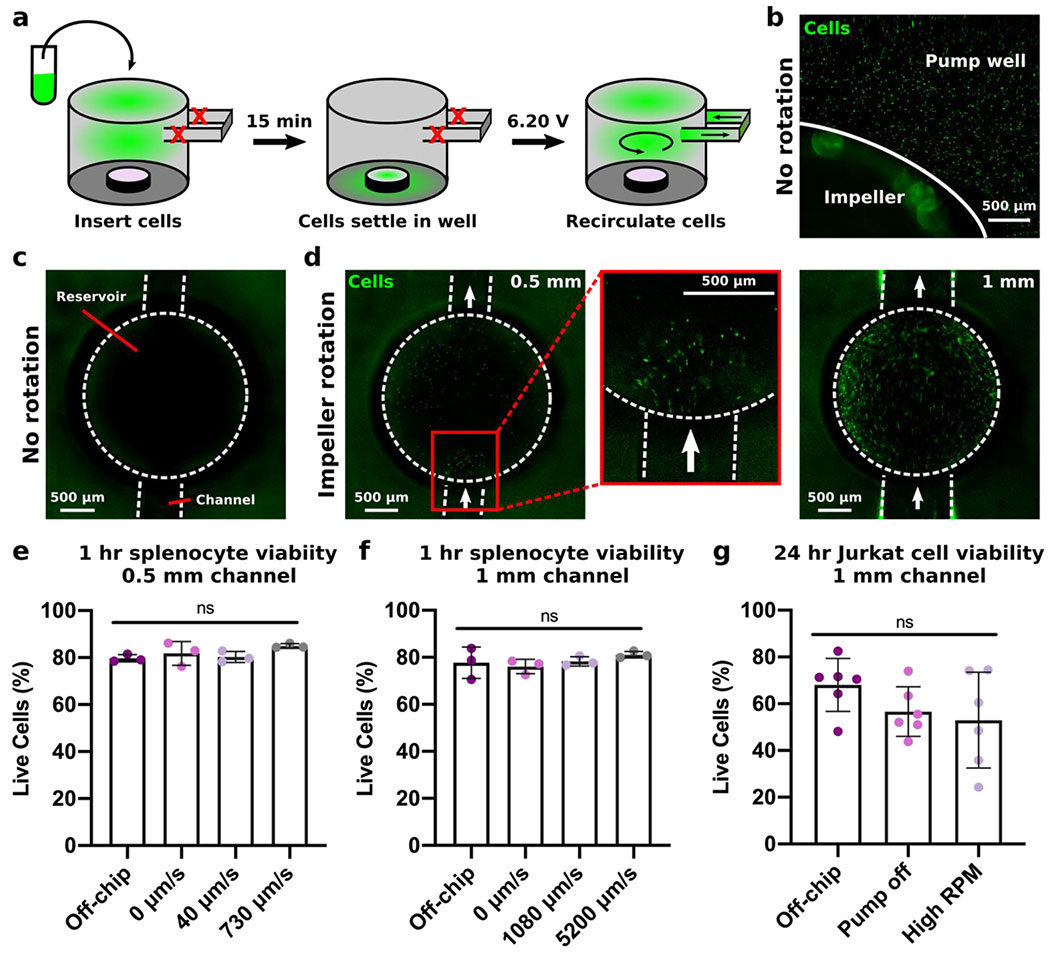
Figure 8. Recirculating cells under different flow regimes
(a) Schematic of the cell recirculation procedure. Cells were labeled with Calcein-AM and inserted into the pump well of a pre-filled device with no impeller rotation. (b) Image of the fluorescently-labelled cells resting on the base of the pump well after a 15 min rest period with the pump off. (c) Image of the reservoir in the channel of the device with no impeller rotation. There are no cells present. (d) Images of cells passing through the reservoir as the impeller rotated for devices with 0.5 mm channels (left, expanded in center) and 1 mm channels (right). (e,f) Quantification by flow cytometry of live (7-AADlow) primary murine splenocytes cultured for 1 hr off-chip, on-chip with no impeller rotation, or circulated at low (6.10 V, 490 RPM) or high speed (7.45 V, 870 RPM) through (e) 0.5 mm channels or (f) 1 mm channels. Viability results were compared using a one-way ANOVA with Tukey post-hoc tests (n = 3). ns indicates p > 0.1. (g) Quantification by flow cytometry of live (7-AADlow) Jurkat T cells cultured for 24 hr off-chip, on-chip with no impeller rotation, or circulated at high impeller RPM (870 RPM, 5200 μm/s) through 1 mm channels. Viability results were compared using a one-way ANOVA with Tukey post-hoc tests (n = 6). ns indicates p > 0.2.
Next, we tested the impact of impeller rotation at various biomimetic fluid velocities on viability of primary splenocytes. We hypothesized that 1 hr would be sufficient to see any impact on cell viability from mechanical damage from impeller rotation. Cells were continuously recirculated through the chip (24-hr post-treated, FormLabs Clear) by the impeller pump for 1 hr, while the whole system was inside a cell culture incubator. Based on the results above, a 0.5 mm channel was used to achieve low velocities similar to those measured within blood capillaries in vivo (Figure 8e),5 and a 1 mm channel was used to achieve higher velocities similar to those measured within lymphatic vessels in vivo (Figure 8f).7 Compared to the off-chip control and cells in the pump well without impeller rotation, there were no significant differences in viability for the cells in fluid moving at 40 μm/s (shear stress of 0.0003 dynes/cm2), 730 μm/s (0.005 dynes/cm2), 1080 μm/s (0.03 dynes/cm2), or 5200 μm/s (0.16 dynes/cm2) (Figure 8e,,f).f). The shear stresses listed are estimated from the flow rate in the channel, which is separate from any stress imparted on cells from impeller rotation (Figure 6). We concluded the impeller-driven micropump did not cause mechanical damage to primary cells even at the higher impeller rotational speeds or flow velocities.
Finally, to model long-term white blood cell recirculation and further test the rotating impeller’s impact on cell viability, Jurkat T cells were circulated at a high speed for 24 hr using the impeller pump platform. The T cells were continuously recirculated on-chip (10-day post-treated, FormLabs Clear resin) at a high impeller rotational speed (7.45 V, 870 RPM, 5200 μm/s, 0.3 dynes/cm2) through 1-mm channels (Figure 8g). Recirculation and impeller rotation did not significantly reduce the viability of the cells compared to static culture in the pump well or off-chip controls (Figure 8g), although variability was high. Variability may be related to the inherent differences between copies of the pump platforms (Figure S4), e.g., due to slight variations in impeller RPM, though this was not tested here. In summary, the microscale impeller pump provided cell recirculation at high impeller rotational speeds for at least 24 hr, making it suitable for future use in microscale cultures and OOCs. We note that separate from compatibility of the resin, the compatibility of impeller-driven recirculation may vary as a function of cell type and impeller speed, and should be tested for each cell type and flow rate of interest.
CONCLUSION
Here, we have reported a novel and user-friendly magnetically-driven impeller pump system for recirculating fluid flow through microfluidic devices. The pump design allowed for the use of inexpensive parts to enable magnetic impeller rotation, which resulted in a simple user interface, no tubing connections, and negligible heat output, making the pump compatible with cell culture incubators. A computational model of the impeller pump was developed to predict the fluid flow through the pump and associated microfluidic chip by using a frozen rotor approach. By varying the dimensions of the channel and inlet as well as the rotational velocity of the impeller, the impeller pump achieved a wide range of physiologically-relevant flow rates, from <50 to >5200 μm/s, and the trends of flow rate as a function of channel cross-sectional area and impeller speed were comparable to the predictions of the computational model. The model predicted low shear stress in the microfluidic channels, with the highest shear at the edges of the rotating impeller where cells were not concentrated, suggesting biocompatibility of the system with recirculating cells. As a proof-of-concept, primary murine splenocytes and Jurkat T cells were recirculated through a microfluidic chip at various biomimetic fluid flow regimes while maintaining high cell viability for up to 24 hr. In the future, the impeller pump will be useful to drive recirculating fluid flow through OOC and multi-organ-on-chip platforms, to study communication and effects of cell recirculation between tissues on-chip.