Single-cell mRNA cytometry via sequence-specific nanoparticle clustering and trapping
Mahmoud Labib1 , Reza M. Mohamadi , Mahla Poudineh , Sharif U. Ahmed , Ivaylo Ivanov1 , Ching-Lung Huang , Maral Moosavi , Edward H. Sargent and Shana O. Kelley
.Cell-to-cell variation in gene expression creates a need for techniques that can characterize expression at the level of individual cells. This is particularly true for rare circulating tumour cells, in which subtyping and drug resistance are of intense interest. Here we describe a method for cell analysis—single-cell mRNA cytometry—that enables the isolation of rare cells from whole blood as a function of target mRNA sequences. This approach uses two classes of magnetic particles that are labelled to selectively hybridize with different regions of the target mRNA. Hybridization leads to the formation of large magnetic clusters that remain localized within the cells of interest, thereby enabling the cells to be magnetically separated. Targeting specific intracellular mRNAs enables circulating tumour cells to be distinguished from normal haematopoietic cells. No polymerase chain reaction amplification is required to determine RNA expression levels and genotype at the single-cell level, and minimal cell manipulation is required. To demonstrate this approach we use single-cell mRNA cytometry to detect clinically important sequences in prostate cancer specimens
We kindly thank the researchers at University of Toronto for this collaboration, and for sharing the results obtained with their system.

Gene expression is a stochastic process, and, as a result, mRNA levels exhibit heterogeneity even within a population of isogenic cells1 . Studies of gene expression are typically carried out via bulk transcriptome measurement approaches, wherein cells are pooled together and their average gene expression is determined. This strategy generates a transcriptional signature of the bulk population of cells.
The desire to instead study cellular heterogeneity in detail has motivated the development of assays that are capable of characterizing gene expression at the single-cell level2 . Most single-cell transcriptional analysis methods are based on RNA sequencing3 , quantitative reverse transcription polymerase chain reaction (RT-qPCR) combined with microfluidics4, 5 , or techniques based on fluorescence hybridization6, 7 . Unfortunately, RNA sequencing requires mRNA isolation and pre-amplification using PCR, and this may result in amplification bias as well as a significant loss of transcripts8 . RT-qPCR combined with microfluidics may provide a closer look at RNA expression within single cells; however, a large percentage of mRNA species can be lost during the purification and processing steps. In addition, the reverse transcription step may introduce artefacts due to template-switching, primer-independent cDNA synthesis, and DNA-dependent DNA polymerase activity9 . Fluorescence in situ hybridization (FISH)10, 11 and other techniques based on nanoparticle probes12 do not require pre-amplification, and several of these methods are semi-quantitative for individual cells analysed in situ. However, often the target mRNA must be labelled with several fluorescent probes to achieve sufficient signal strength, and this precludes accurate quantitation. Moreover, for the analysis of rare cells such as circulating tumour cells (CTCs), cells must first be captured from whole blood, identified, and then subjected to expression analysis. This introduces uncertainty about how the analysis workflow affects the results obtained.
Measurements at the single-cell level are particularly important for the study of cancer cells and tumours. Tumours are inherently heterogeneous; different regions of a tumour may experience different levels of exposure to oxygen, chemotherapeutics and other biochemical factors. CTCs are rare tumour cells shed from primary and metastatic tumour sites into the circulation as viable and apoptotic cells, and may exhibit even greater heterogeneity because of dynamic changes correlated with their presence in the bloodstream13.
Here, we report an approach—single cell mRNA cytometry—that utilizes nanoparticle-mediated profiling of cancer cells at the single-cell level based on the expression of specific mRNA sequences. Cellular mRNAs are targeted with pairs of probes appended to magnetic nanoparticles (MNPs). Hybridization of mRNA sequences with the tagged MNPs triggers the formation of microscale magnetic clusters that become trapped within the cells. The clusters enhance the magnetic susceptibility of the cells and facilitate their capture within a fluidic device (Fig. 1 and Supplementary Fig. 1). The device features different capture zones that trap cells with differing magnetic susceptibilities, and after immunostaining, individual cells are then readily visualized within the device to determine their RNA levels. This mRNA profiling approach does not require enzymatic amplification, and is therefore free of amplification bias. It is quantitative when benchmarked against PCR, and is amenable to the analysis of low (~10) numbers of cells, an important feature for the analysis of low levels of bloodborne cells like CTCs. Although numerous methods have been applied to the capture and analysis of CTCs14–28, we do so by targeting intracellular mRNAs.
Results and discussion
We set out to develop a mRNA cytometry approach to monitor RNA expression at the single-cell level. To achieve this goal, it was necessary to explore how intracellular RNAs could be efficiently accessed and labelled. We found that pairs of DNA-labelled magnetic nanoparticles could be introduced into cells, self-assembled in the presence of target mRNA, and that cells containing the assembled particles could be sorted using a microfluidic strategy that reported on the number of nanoparticles contained within individual cells. This approach provided a way to analyse quantitatively the expression of mRNA sequences in cultured cancer cells and circulating tumour cells found in patient samples.
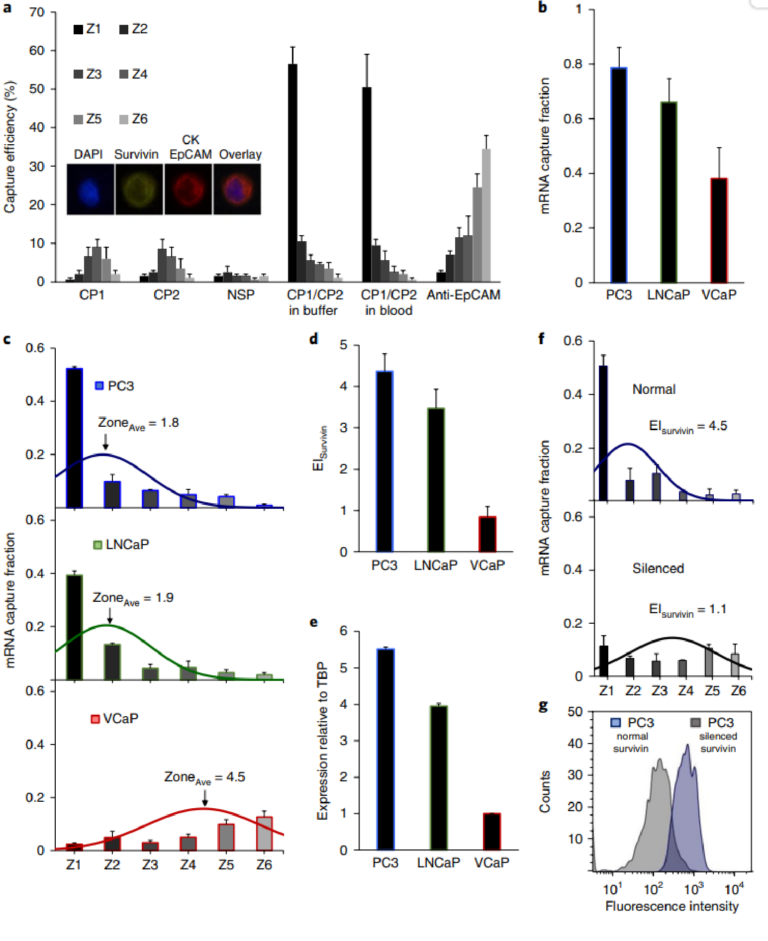
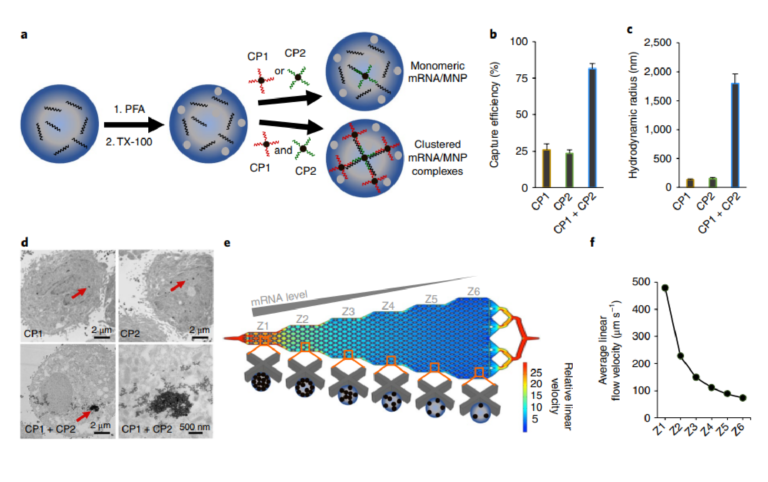
Fig. 1 | Cellular mRNA analysis approach. a, Cells are fixed with 4% paraformaldehyde (PFA) and permeabilized with 0.3% Triton X-100 (TX-100). The cells are incubated with two capture probes (CP1 and CP2), which are composed of magnetic nanoparticles (MNPs) conjugated to DNA sequences complementary to the target mRNA. Clusters of MNPs are formed and trapped within the cells if two independent capture probes are used. b, When PC3 cells are subjected to magnetic capture based on the targeting of survivin mRNA, only low levels of cell capture are observed if single capture probes are used, whereas when two capture probes are coincubated with the cells, capture efficiency is increased significantly. c, Dynamic light scattering measurements of the hydrodynamic radius of magnetic nanoparticles subsequent to hybridization of survivin RNA with either individual capture probes or the combined probes. Statistical analyses of data are provided in Supplementary Tables 2−7. d, TEM images of PC3 cells after targeting survivin mRNA with CP1, CP2 or CP1 + CP2. e, Device with six sequential zones that feature different average linear flow velocities (1×, 0.47×, 0.31×, 0.23×, 0.18×, 0.15×) to facilitate capturing cells with different magnetic content. Cells with high magnetic content are captured in the first zone, whereas cells with medium to low magnetic content are captured in later zones. f, Distribution of linear velocities at a flow rate of 600 µl h−1 for zones 1–6.
Single-cell mRNA cytometry based on intracellular assembly of magnetic clusters.
Our approach to mRNA cytometry at the single-cell level is based on magnetic capture of cells using iron oxide nanoparticles functionalized with DNA capture probes complementary to an mRNA sequence of interest (Fig. 1a). The capture probes are designed to be specific for a target mRNA. To allow the nanoparticles to penetrate the cells, cells are fixed, permeabilized and then incubated with the particles.
We found that the use of single nanoparticle-tethered capture probes was not sufficient for high levels of magnetic capture. In proof-of-concept studies monitoring the capture efficiency of a model cell line, low capture efficiencies were observed when a single capture probe was used (Fig. 1b).
In contrast, when a combination of two capture probes were used, capture efficiency increased significantly. Dynamic light scattering measurements revealed that combining the two capture probes produced large aggregates in the presence of the complementary target strand, indicating that the dual probe strategy triggered the self-assembly of large magnetic clusters. (Fig. 1c and Supplementary Fig. 2). These clusters are probably retained within the permeabilized cells, whereas the single nanoparticles could diffuse out of the cells even after binding a target sequence. TEM studies confirmed the presence of nanoparticle clusters within cells containing a target sequence (Fig. 1d).
The cells bearing internalized MNPs are trapped within a fluidic device that features six zones exhibiting differing linear velocities to allow differential sorting of cells with varying levels of bound MNPs (Fig. 1e,f). Because MNPs have low magnetic susceptibilities, the fluidic channel contains X-shaped microfabricated structures to create localized subzones of low flow velocity and favourable capture dynamics. The first zone has a high linear velocity and thus retains cells with high magnetic content because the retaining magnetic force overcomes the drag force created by the locally high flow velocity. The following five zones exhibit gradually reduced linear velocities (see Fig. 1f and Supplementary Information for simulation information). This design allows cells with high magnetic content (that is, high mRNA expression) to be trapped in the first zone, whereas cells with lower mRNA expression become trapped in later zones based on their mRNA level. This device design has been used to perform high-resolution qualitative profiling of extracellular proteins29; however, this is the first report that applied this device to nucleic-acid-based capture.
Profiling of a mRNA sequence using single cell cytometry. In the first suite of experiments, we assessed the capture efficiency of a device designed to facilitate mRNA cytometry and its ability to sort cells bearing different numbers of MNPs. Cultured PC3 cells, a prostate cancer cell line, were labelled with two MNPs targeting the mRNA for survivin, a gene sequence that has been explored as a potential cancer biomarker. Survivin promotes cell division and suppresses apoptosis in many human cancers. The antiapoptotic effect is related to its ability to inhibit caspases either directly or indirectly30. The transcription of the survivin gene is higher in
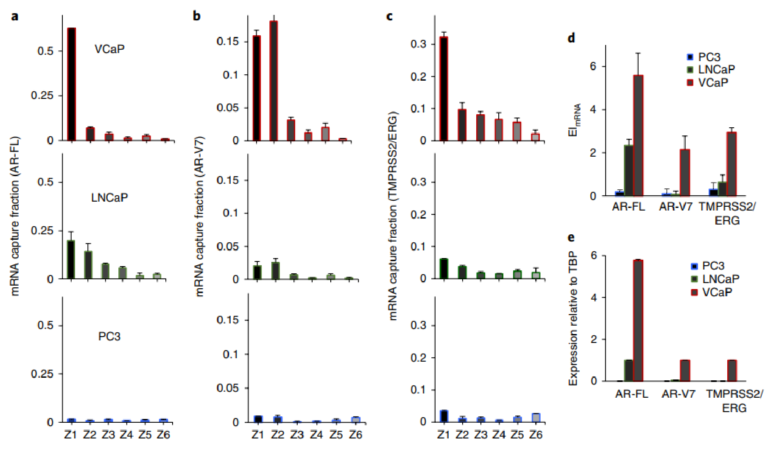
Fig. 2 | Cell capture and profiling mediated by mRNA-directed magnetic nanoparticles. a, Capture efficiency of PC3 cells after incubation with CP1 (complementary to survivin mRNA), CP2 (complementary to survivin mRNA), a non-specific probe (NSP), and a combination of CP1 and CP2 in a buffer solution and blood. A control experiment was carried out in which PC3 cells were captured using magnetic nanoparticles tagged with anti-EpCAM. One hundred cells were used in these trials. The inset shows the immunostaining combination used to identify cancer cells. b, Cellular analysis of survivin mRNA in PC3, LNCaP, and VCaP cell lines. Two hundred cells were used in these trials. The curves represent the normal distribution fit to the capture data. The mRNA capture fraction reflects the capture using mRNA-targeted nanoparticles relative to those labelled with anti-EpCAM. c, Overall mRNA capture fraction for PC3, LNCaP, and VCaP cells, which compares the number of cells captured with mRNA-targeted nanoparticles versus anti-EpCAM targeted nanoparticles. d, Expression index, which reflects the mRNA capture fraction divided by the average capture zone. e, Survivin expression levels determined by RT-qPCR. f, EISurvivin in PC3 cells before and after silencing the survivin gene with LY2181308 siRNA. Two hundred cells were used in these trials. The curves represent the normal distribution fit to the data. g, Flow cytometric analysis of survivin protein in PC3 cells before and after silencing the survivin gene. Statistical analyses of data are provided in Supplementary Tables 8−11.
tumours than in normal tissue and is often correlated with metastasis and poor prognosis in cancer patients31. The cell trapping profiles obtained by targeting the survivin mRNA were visualized by immunostaining cells with epithelial markers (EpCAM, CK) and also by confirming the presence of well defined cell nuclei using the nuclear stain DAPI (Fig. 2a). CD45 was also included in the immunostaining protocol to enable the identification of white blood cells when whole blood samples were processed. When CP1 and CP2 were used separately, very low levels of cells were captured (Fig. 2a). A non-specific capture probe (NSP) was also used and did not produce significant levels of trapped cells. However, when CP1 and CP2 were used together, much higher levels of cells were observed in the capture device, and the cells were visualized primarily in the first zone of the capture device, indicating high levels of expression. The capture profile and efficiency were unaffected if the PC3 cells were spiked into whole blood. To provide a means of gauging the overall capture efficiency, capture was also carried out with an anti-EpCAM antibody
Fig. 3 | Analysis of clinically relevant mRNAs. a–c, Analysis of AR-FL (a), AR-V7 (b) and TMPRSS2/ERG (c), in PC3, LNCaP and VCaP cell lines using single-cell mRNA cytometry. Two hundred cells were used in these trials. e, d, The overall mRNA expression was determined using the magnetic ranking approach (d) and RT-qPCR (e). Statistical analyses of data are provided in Supplementary Tables 12−20. The agreement between the EI values measured with magnetic ranking cytometry and the relative expression levels calculated using RT-qPCR indicates that the new single-cell level technique is quantitative.
conjugated to MNPs. EpCAM is an epithelial marker found on the surface of tumour cells, and therefore is a standard protein marker to target particularly when cancer cells are isolated from blood. In all trials in which cellular mRNA was tagged with MNPs, a separate sample aliquot was analysed using anti-EpCAM to provide an overall cell or CTC count.
Three prostate cancer cell lines (PC3, LNCaP and VCaP) were tested in parallel to compare capture efficiencies and the profiles collected using mRNA cytometry (Fig. 2b, Supplementary Fig. 3). The cells were spiked into blood to ensure that heterogeneous samples were compatible with the approach. The number of cells captured using anti-EpCAM was compared to the number captured using the mRNA-directed approach to determine the overall mRNA capture fraction. For each of the cell lines tested, the overall, EpCAMmediated capture efficiencies were high (VCaP 92±4%, LNCaP 95±3%, PC3 92±6%), but for the mRNA-targeted trials, the capture levels varied (VCaP 38±11%, LNCaP 66±9%, PC3 79±8%), reflecting the varied expression of survivin in these cell lines. The comparison of the levels of capture when mRNA-targeting was used compared to EpCAM-targeting allowed us to estimate the capture fractions (Fig. 2c). Levels of nonspecific capture were taken into account in the calculation of capture fraction (see Supplementary Information). These studies were conducted with 200 cells spiked into one millilitre of blood; comparable results were obtained with 15 and 50 cells in the same volume (Supplementary Fig. 4). While a low level of non-specific capture of white blood cells was observed (Supplementary Fig. 5), these cells do not cause false positives because of their distinct staining profiles.
For each cell line, the median zone of capture was determined to provide a parameter that could be used to refine the calculation of relative RNA expression for the cell lines. The PC3 and LNCaP cells were primarily captured in the early zones of the device and had average zone values of 1.8 and 1.9, respectively. The VCaP cells, in addition to having a much lower overall capture efficiency, had a much larger average zone value of 4.5. An expression index (EI) for the survivin mRNA was then calculated for each cell line; values are shown in Fig. 2d. The EI was calculated by dividing the capture fraction by the average zone parameter as described in the Supplementary Information. For example, for PC3 cells, the average zone value is 1.8 (Fig. 2b), and the overall mRNA-mediated capture efficiency relative to anti-EpCAM mediated capture is 0.79 (Fig. 2c). The EI is therefore calculated to be 4.4 (Fig. 2d). For VCaP cells the capture efficiency is 0.38 (Fig. 2c) and the average zone is 4.5 (Fig. 2b). The EI is therefore calculated to be 0.84 (Fig. 2b).
RT-qPCR was performed using the same cell lines to evaluate the relative expression of survivin. TATA-box binding protein, TBP, was used as a standard, and the expression levels of survivin were compared to TBP for each cell line (Fig. 2e). The levels of expression measured using mRNA cytometry (Fig. 2d) and PCR (Fig. 2e) are comparable, indicating that the method offers a quantitative approach to monitoring gene expression. For example, the EI values for PC3 and VCaP calculated using single-cell mRNA cytometry are 4.4 and 0.84, respectively, and the relative expression levels measured using PCR are 5.5 and 1. The values measured using the two methods agree within measurement error. The concordance of our expression index measurements with PCR-based RNA quantitation provides support to the notion that mRNA cytometry is quantitative, which could not be assumed because cells with a given number of nanoparticles could settle in a number of different adjacent zones (see simulations in Supplementary Information). These results also support the notion that the uptake of magnetic nanoparticles by the different cell types does not influence the expression profiling capability of this mRNA-targeted approach.
We then proceeded to demonstrate the selectivity of the approach by analysing survivin mRNA in PC3 cells before and after silencing the survivin gene with a small interfering RNA (siRNA). PC3 cells were transfected with LY2181308, a previously characterized siRNA directed against survivin32. We found that the